Azure Monitoring
Discover and monitor all your Azure resources in minutes using Site24x7's Azure Monitoring. Set up alerts, associate tags with resources, automate actions, and analyze trends in customizable dashboards.
- Authenticate Site24x7
- Add a monitor
- List of services monitored by Site24x7
- Bulk actions
- Inside an Azure resource monitor page
- VM Extensions
- Security
- Licensing
- FAQs
Other supported features:
- Dashboards
- Management actions | Resource dependencies
- Activity logs | Resource logs
- Forecasting
- Alerting | Reports | Monitor groups
- IT automation | Anomaly dashboard
- Guidance report
- Azure Deployment Manager (ADM) Health Check
Authenticate Site24x7
- Log in to your Site24x7 account and go to Azure > Add Azure Monitor. You can also navigate via Admin > Inventory > Add Monitor > Azure.
- The Azure resources can be added for monitoring using the following way:
- Authenticate with Custom App: Create your own app in the Microsoft Azure portal and assign the necessary permissions to enable Site24x7 to start monitoring the Azure resources.
Add a Monitor
Once access is successfully granted, you will be redirected to the Site24x7 web client to add a monitor. In the Add Azure Monitor page:
- Provide a unique Display Name for identification purposes.
- Associate the monitor with existing or new Monitor Groups.
- Under Azure Resource Filter, select the Subscriptions, Resource Groups, and the Service/Resource Types to discover and start monitoring them.
- By default, all the subscriptions and the service types in your Azure account will be selected for monitoring.
- New resources will only be discovered once every 30 minutes.
- Toggle Yes to Auto-add New Resource Groups for Monitoring when a new resource group/service type is added in the Microsoft Azure portal. This will ensure they are automatically discovered and added for monitoring. By default, the option is No.
- Use tags from your Azure portal to Exclude or Include Azure Resources from monitoring. Mention the key-value pair and use the (+) icon to add more combinations.
- Toggle Yes to Disable Auto Discovery of New Resources. This means no new resources will be auto-discovered and added to Site24x7 for monitoring during the next consecutive discovery/data collection. By default, the option is No.
- If the service type is VM, install the Site24x7 Server Monitoring agent (as an Azure VM extension) in all the virtual machines present under the selected subscription to get more than 60 performance metrics. By default, this option is set to Yes.
- Under Resource Termination Settings,
- Toggle Yes to Mute Resource Termination Alerts if you don't want to receive alerts when the terminated resources are automatically suspended/deleted from Site24x7.
- Toggle Yes to Monitor Terminated Resources to ensure monitoring continues for terminated resources. The monitor will be DOWN, and the polling will continue until manually suspended.
- Toggle Yes to Automatically Remove Terminated Resources from monitoring. You can also choose to define a specific time period (in days) to determine how long the terminated resources should be retained in the Site24x7 web console before permanent deletion. Learn more on how this works.
- Select existing Notification Profiles, User Groups, Site24x7 Tags, or add new ones. You can also integrate Site24x7 alarms with your preferred third party service.
- Click on Discover Azure Resources to discover and start monitoring.
Please wait a few minutes for all of your Azure resources to be added in Site24x7's web client. Once discovery is complete, you'll be directed to the Infrastructure dashboard.
Dashboards
There are three exclusive dashboards for Azure in Site24x7. You can also create custom dashboards.
Infrastructure Dashboard:
Once you've successfully added an Azure monitor, you'll be directed to the Infrastructure dashboard. This represents a NOC view of all the Azure resources discovered from your account. Hover on the hamburger icon beside the page title to Edit, Suspend, Delete the Azure monitor and discover resources (Discover Now) immediately.
Highlights:
- See the number of Azure resources discovered in a single dashboard.
- View resources according to their status: UP, DOWN, or DISCOVERY IN PROGRESS.
Any monitors that are shown as DISCOVERY IN PROGRESS are actually yet to be updated with their current status from your Azure account. This status is not related to the actual status of these Azure resources in the Azure portal.
- Filter resources based on resource groups, services, locations, and status.
- Click on a NOC box to go to that particular monitor's Summary page.
Inventory Dashboard:
Go to Azure > Inventory Dashboard. Like the Infrastructure dashboard, the Inventory dashboard gives you a view of the Azure resources discovered from your account. Hover on the hamburger icon beside the page title to Edit, Suspend, Delete the Azure monitor and discover resources (Discover Now) immediately.
Highlights:
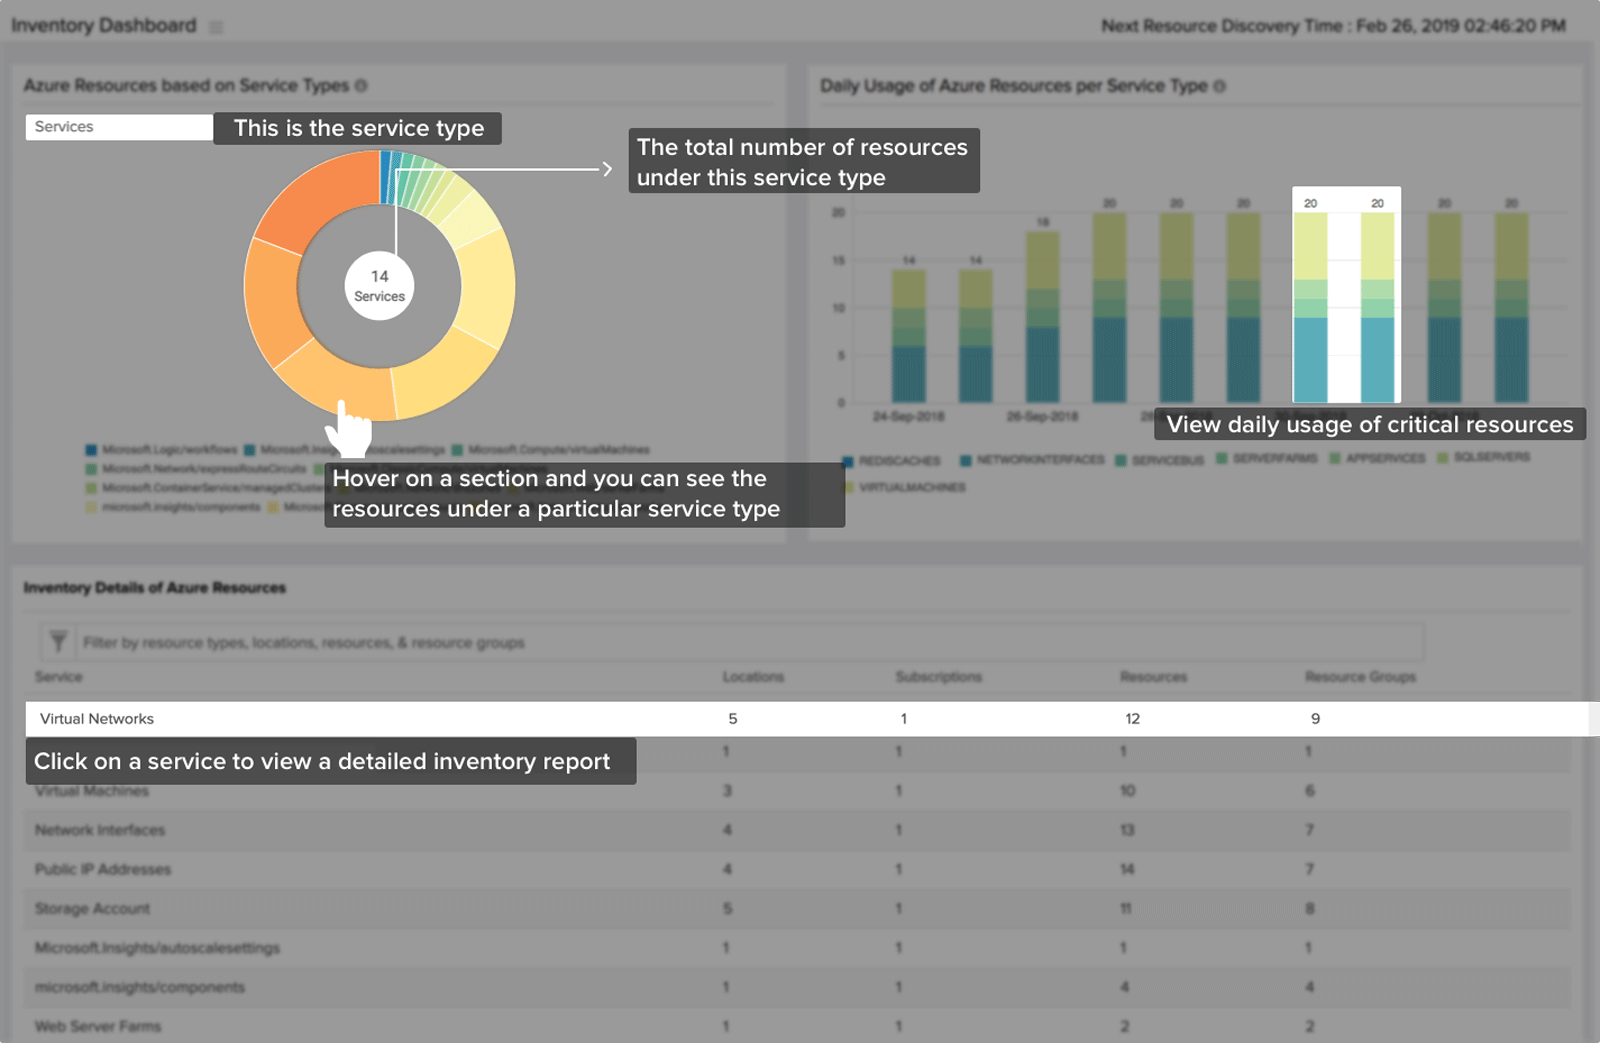
- View all discovered Azure resources broken down by service type in a single pie chart. Hover over a section of the chart to see the resources under a particular service type.
- View the daily usage of critical resources for a set of service types.
As of now, Site24x7 can only show the resource usage for the following service types:
- Redis Caches
- Network Interfaces
- Service Bus
- Server Farms
- App Services
- SQL Servers
- Virtual Machines
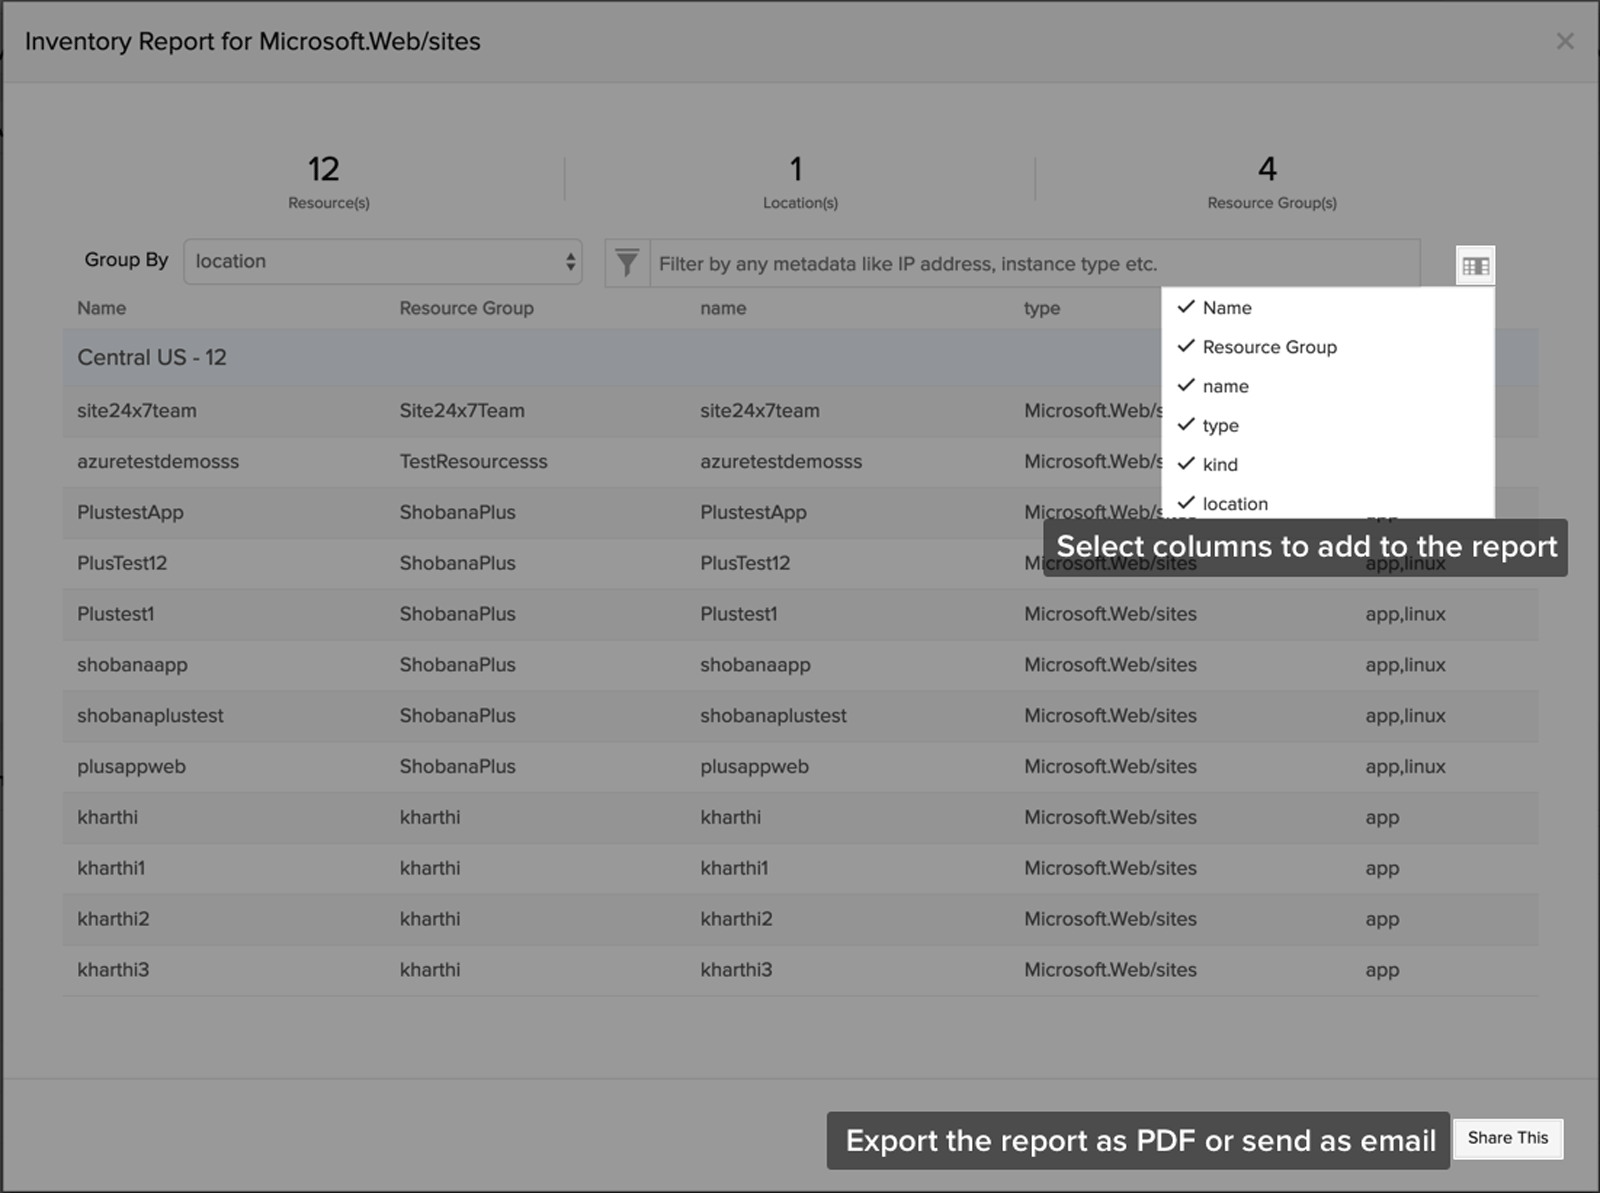
- Under Inventory Details of Azure Resources, get a tabular view of all your Azure services, along with their respective number of locations, subscriptions, resources, and resource groups. You can also filter out services based on locations, resources, and resource groups.
Custom Dashboard:
You can build your own dashboard that displays various key metrics across all your Azure resources. To start, navigate to Home > Dashboards > Custom Dashboards > + Create new.
- Provide a suitable name and description for your dashboard.
- Under Widget Category, choose either from Performance Widgets, Top N Widgets, or Current Status Widgets.
- Select All Monitors under Filter Monitors by Monitor Group. Under Monitor Type, select Azure.
- Choose the desired Service Type template.
- Pick your Azure resources under Choose Monitors to create your dashboard.
- Select the required Time Period and drag and drop the widgets onto the working space.
- When you're done, click on Done Customizing at the top of the page.
Management Actions
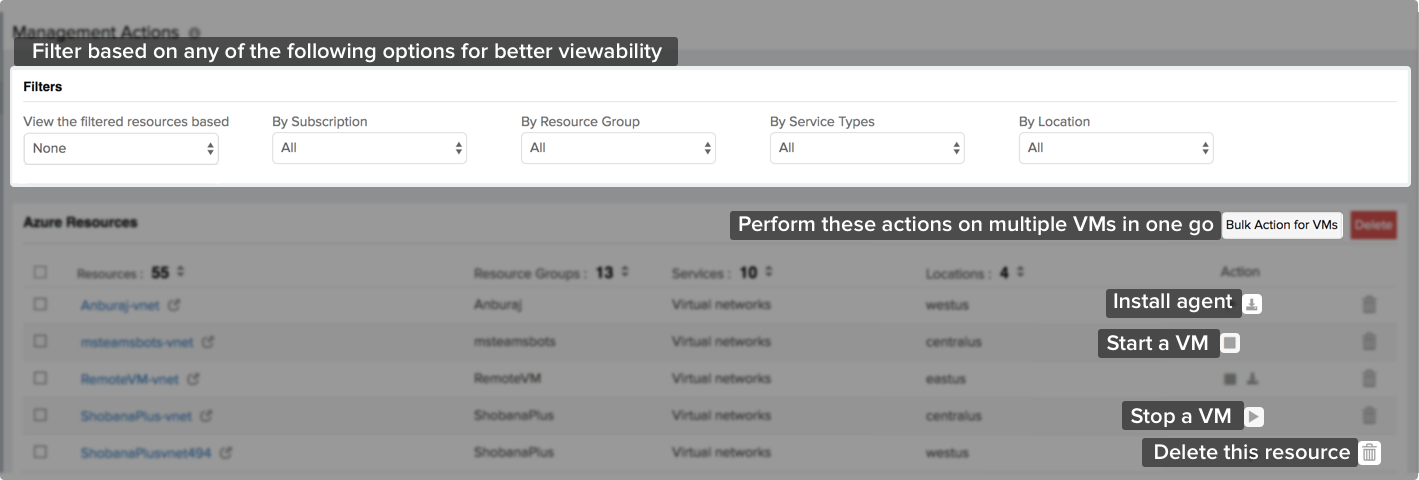
Go to Azure > click on the Azure monitor > Management Actions. Under these management actions, you can perform bulk actions, start or stop your VMs, install the server monitoring agent extension, and filter resources based on subscription, resource group, service, and location for better visibility. Hover on the hamburger icon beside the page title to Edit, Suspend, Delete the Azure monitor and discover resources (Discover Now) immediately.
Tip: Only a Site24x7 admin or super admin can perform these actions.
- Delete Resources: Use the trash icon to delete a single resource. Delete multiple resources at once by using the Delete button at the top.
When you delete a resource, Site24x7 will stop monitoring it. That resource will not be deleted from your Azure account. On the other hand, if a resource is deleted from your Azure account (in the Azure portal), it will still be visible in the Site24x7 web client, but the monitor status will be DOWN.
- Actions specific to VMs: You can start/stop VMs and install the Site24x7 Server Monitoring agent extension for every single discovered VM. Use the Bulk Action for VMs button to perform these actions on multiple VMs in one go.
Ensure the VM is up and running before installing the Site24x7 Server Monitoring agent extension.
Activity Logs
Every action that you perform in the Azure portal will be registered as a log entry. The Activity Logs page will list all the logs from your Azure account - in one place. Log data will be refreshed every five minutes.
Get Started:
- Log in to Site24x7 and go to Azure > click on the Azure monitor > Activity Logs.
The Activity Logs tab will not be visible if you have not integrated with Site24x7 AppLogs. To start collecting logs, go to Admin > AppLogs > Settings > select Yes for the option Collect application logs from servers using AppLogs. From the next data collection (i.e. after five minutes), the Activity Logs tab will show up under your Azure monitor and log data will be captured.
- Type in a query and click on the search icon
to search through the logs.
- Choose a time period to view logs for a select period of time.

Resource Logs
Monitor the operations performed within the Web App resources. On enabling this integration, Site24x7 will create a unique resource group "Site24x7Applogs-<location>" and new resources of type Storage Account, Event Grid, and Function App in the location where the resource is present. Using these newly create resources, logs will be collected from every resource present in that location in real-time. Learn more on how logs are collected from Azure.
Highlights:
- View all your diagnostic/resource logs in one place.
- Get powerful insight and receive alerts from your log data with just a button click.
- Correlate logs along with other monitoring data.
- Support for complex queries like groupby, timeslice, and more.
- Out-of-the-box support for most of the log types. If you don't find a log type, post it in our community and we will add it for you.
To enable this feature, go to Azure > click on the Azure monitor > Azure Web Sites > click on a resource > Resource Logs. Click on Enable Resource Log Collection and select the log categories to be monitored. In the next data collection, the logs will be collected and can be viewed here.
Resource Dependencies
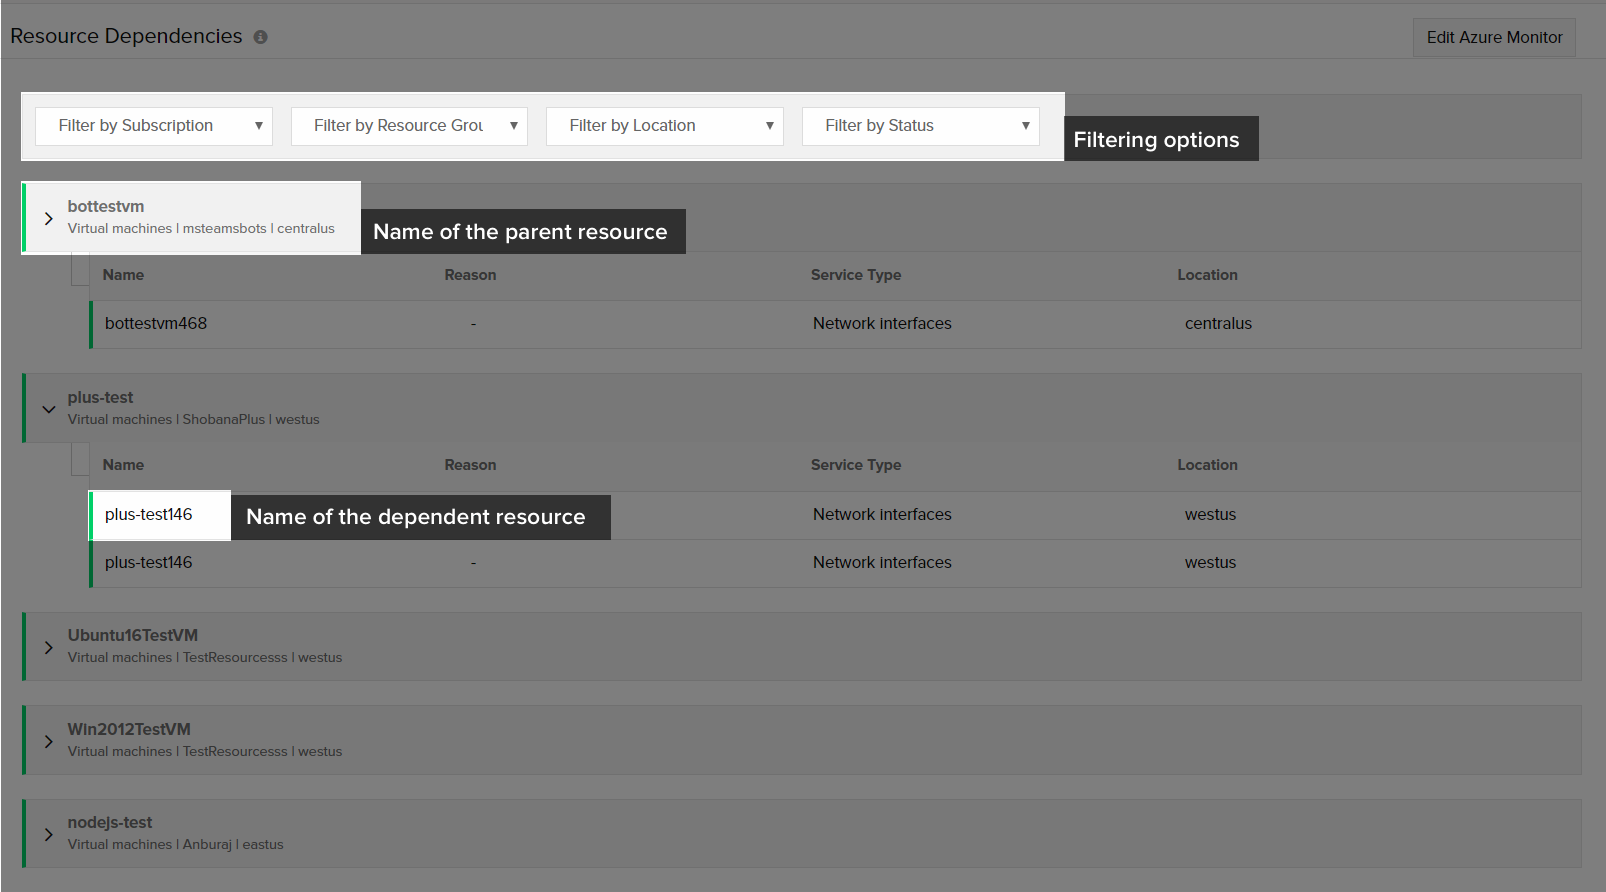
All Azure resources will have a dependent resource for their proper and continued functioning. This page lists down all the discovered resources with the resources they are dependent on, along with its status (reason), service type, and location. Listing down the dependent resources helps to find out the reason behind the downtime of the parent resource.
As of now, Site24x7 shows the dependent resources for only three service types (Virtual Machines, App Services, and Virtual Machine Scalesets).
Guidance Report
Get best practice recommendations to optimize costs, increase performance and reliability of your Azure services.
Bulk Actions
Apply changes to all your Azure subscriptions, resource groups, and locations in one go. In the Site24x7 web client, go to Admin > Bulk Action. The following bulk actions are supported:
- Modify threshold profile
- Modify notification profile
- Modify user alert groups
- Modify IT automations
- Delete monitors
- Suspend monitors
- Activate monitors
- Associate with/dissociate from monitor groups
- Associate with tags
VM Extensions
Virtual Machines (VMs) are an important type of Azure resource to be monitored. Like the other resources, VMs will be auto-discovered and marked for monitoring once an Azure monitor is added in Site24x7. You can perform management actions like starting or stopping a VM from the Site24x7 web client.
Further, for in-depth VM metrics like CPU percentage, disk usage metrics, network In/Out, you can install the VM extension.
Installing the VM Extension:
- Ensure to use Linux agent 17.5.2 and above and Windows agent 19.7.0 and above to enable the VM extension.
- Go to Azure > Virtual Machines > click on the required VM > Server Monitoring Agent Extension > Get Started Now. Select the VMs to which you'd like to install the agent extension for and click Submit.
- Once our agent extension is installed in the Azure VM resources, monitor system-level metrics and other features including 100+ plugin integrations, IT Automation, detailed root cause analysis reports, event logs/syslogs monitoring, and more.
- Every instance under a VM scaleset can be monitored with the same VM extension. Monitoring every instance under a VM scaleset can help understand individual VM instance performance, including their resource utilization.
If the Upgrade Policy of the VM scaleset in the Azure portal is set to Automatic, the VM extension will be applied to all instances under the scaleset, irrespective of the instance chosen in Site24x7.
Alerting
You can create new or associate existing threshold profiles for every Azure resource that's being monitored. Follow the steps below to create a threshold profile:
- Go to Azure > click on a service type > click on the resource you'd like to associate with a threshold profile.
- Hover over the hamburger icon next to the display name. Click Edit.
- Under Advanced Configuration > Threshold and Availability, click on the plus icon (+) to create a new profile. Click on the pencil icon (
 ) to edit an existing profile.
 - Save your changes.

Reports
Log in to Site24x7 and go to Reports > Azure. The reports available for Azure monitors are based on the service types available in your Azure account.
- Availability Summary Report

- Performance Report

- Top N Reports by Attribute

- Health Trend Report
- Inventory Report
Monitor Groups
You can associate both service types and individual resources with Monitor Groups.
Service type level:
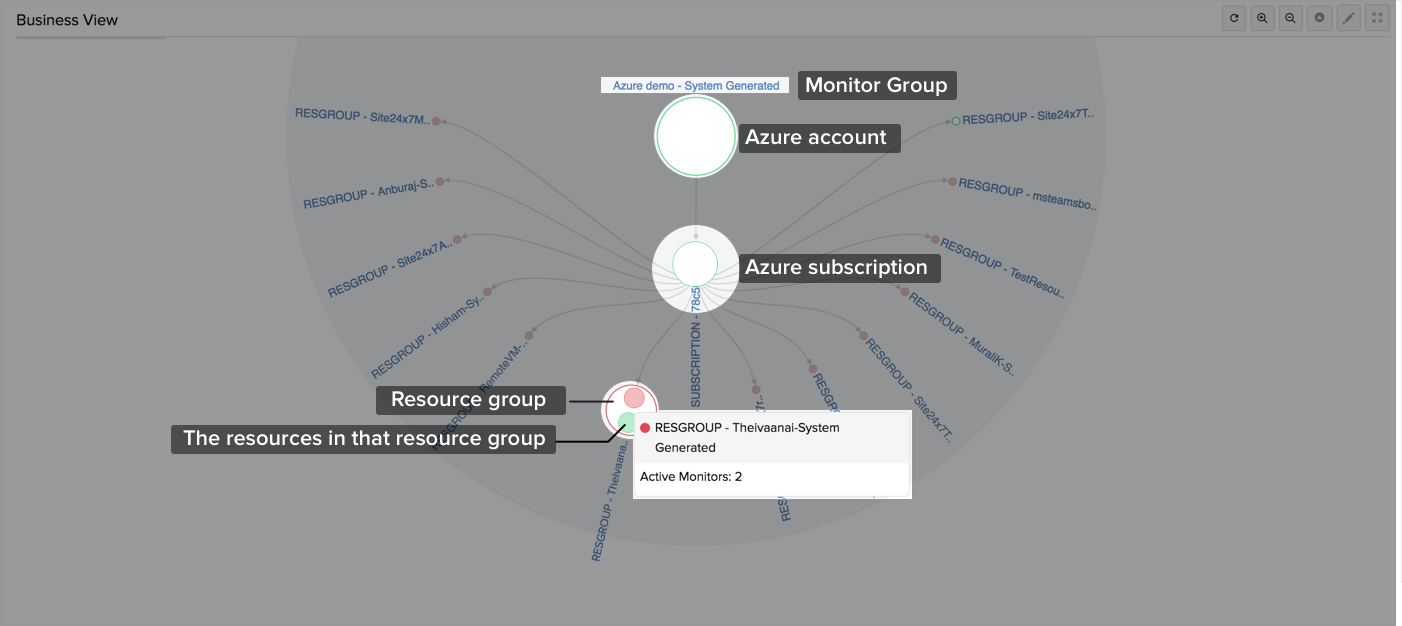
Once a service type is added, a monitor group called Azure_demo - System Generated Group is created automatically. Go to Home > Monitor Groups. Click on the created monitor group and navigate to the Business View tab. This view helps you spot outliers and detect unusual monitoring patterns in your monitor group and associated subgroups (Note: resource groups are considered subgroups). Learn more.
Resource monitor level:
- Go to Cloud > Azure and click on the Azure monitor. Click on any of the service types listed in the left panel, then select the desired resource monitor.
- Hover over the hamburger icon beside the display name, then click Edit.
- In the Edit Azure Resource Monitor page under Advanced Configuration > Associate Monitor Groups, select an existing monitor group from the drop-down or use the plus icon (+) to create a new one.
IT Automation (only for VMs)
You can add automations only for Azure resources. VMs have exclusive automation types, like starting or stopping a VM. Log in to Site24x7 and go to Admin > IT Automation Templates (+) > Add Automation Templates. Once an automation is added, you can schedule them to be executed one after the other.
Forecasting
Predict future points of an Azure service performance metric (measurement of resource usage) based on historical observations.
Site24x7 uses machine learning and traditional time series forecasting models like exponential smoothing to predict future values. To choose the right model, the time series data is broken down into systematic and unsystematic components like level, trend, seasonality and, noise.
How to view forecast charts?
- Go to Cloud > Azure > click on the Azure monitor. Click on any of the service types listed in the left panel, then select the desired resource monitor.
- Navigate to the Forecast tab to view the charts.
Anomaly Dashboard
Azure monitoring is AI-powered and helps detect any unusual spikes or aberrations in your resource's critical performance attributes. This fine-tunes your resource performance and safeguards your Azure infrastructure from any unforeseen issues. To view the anomaly dashboard for Azure,
- Log in to Site24x7 and go to Home > Anomaly Dashboard.
- Select a time span from the Time Period drop-down. You can search for your Azure monitor's anomalies by looking up the name(s) in the Search Bar or filtering it out based on the various severity levels.
You can view the Anomaly Summary graph for the requested time period and the specific reason for each detected anomaly (listed under Anomaly History). To gather further insight on the root cause of performance issues, click on Analyze Root Cause provided along with the anomaly description (under Anomaly History). Learn more.
Tags
Every resource can have one or more tags associated with it in the Azure portal. When resources are discovered and added for monitoring in Site24x7, the tags created in the Azure portal are automatically associated with the right resources in the Site24x7 web client. You can use these tags to include or exclude specific resources from monitoring. In addition to these imported tags, you can also create new tags or associate existing Site24x7 Tags with your resource monitors for easy filtering.
Inside an Azure Resource Monitor Page
All your Azure resources will be listed based on their service type. Click on any desired service type, and then on a particular resource monitor. You'll find five tabs on the Azure resource monitor page:
- Summary - View the performance metrics of your Azure resources, and the last polled data of your numeric attributes.
- Configuration Details -
- ID - This is the unique ID created for each Azure resource.
- Name of the resource
- Associated service type
- Location
- Outages
- Inventory
- Log Report
Azure Deployment Manager (ADM) Health Check
Monitor the health of your services to detect any service health issues and ensure reliable deployments and high availability of your services. Please follow the steps below to start the health check:
- Log in to Site24x7 and go to Azure > click on the Azure monitor > ADM Health Check.
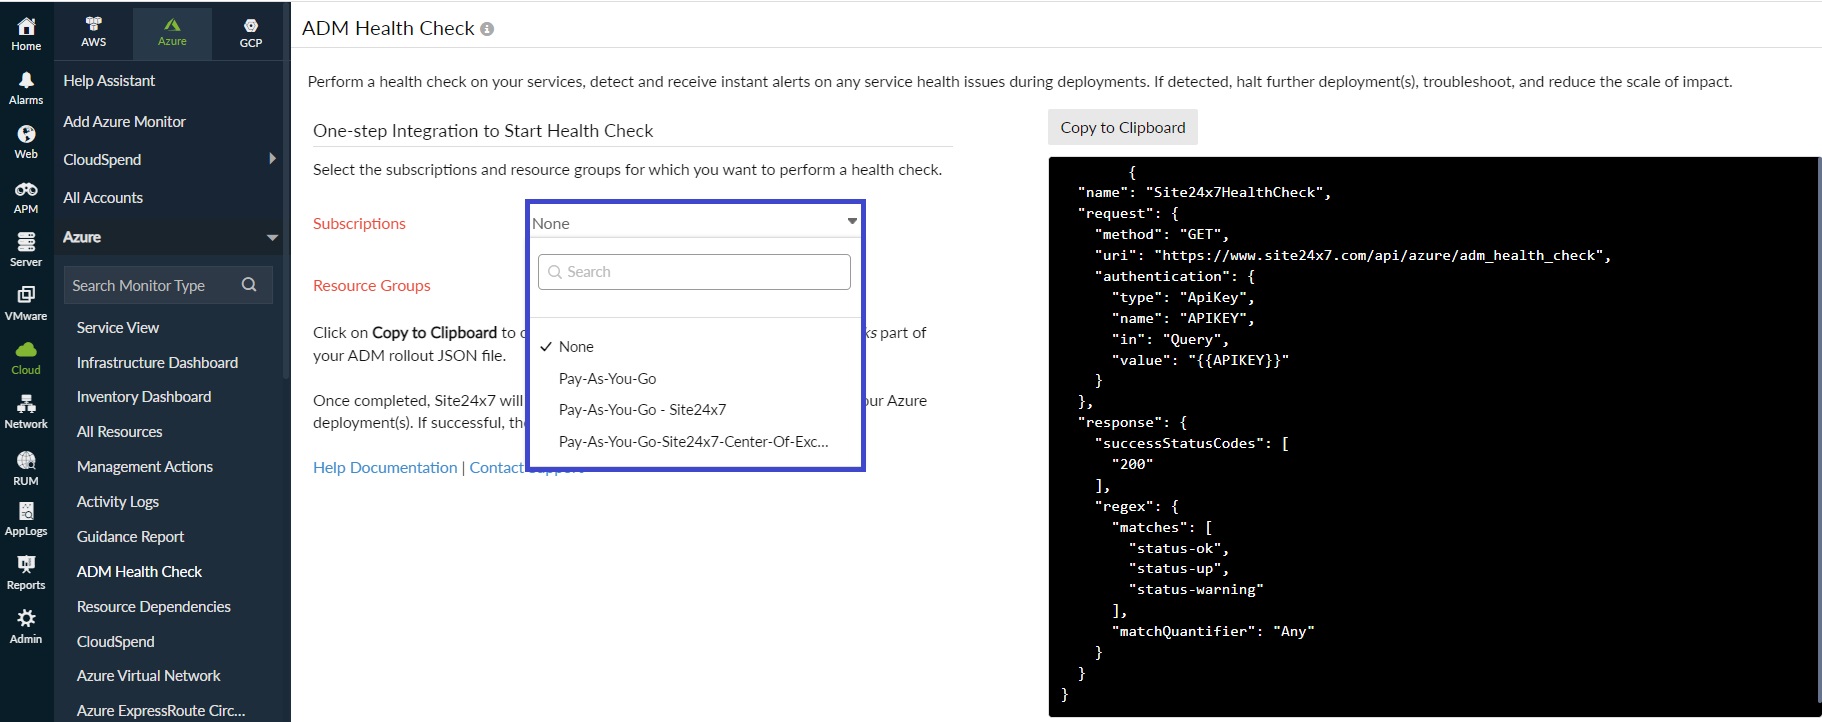
- Select the Subscriptions and Resource Groups for which you want to perform a health check.
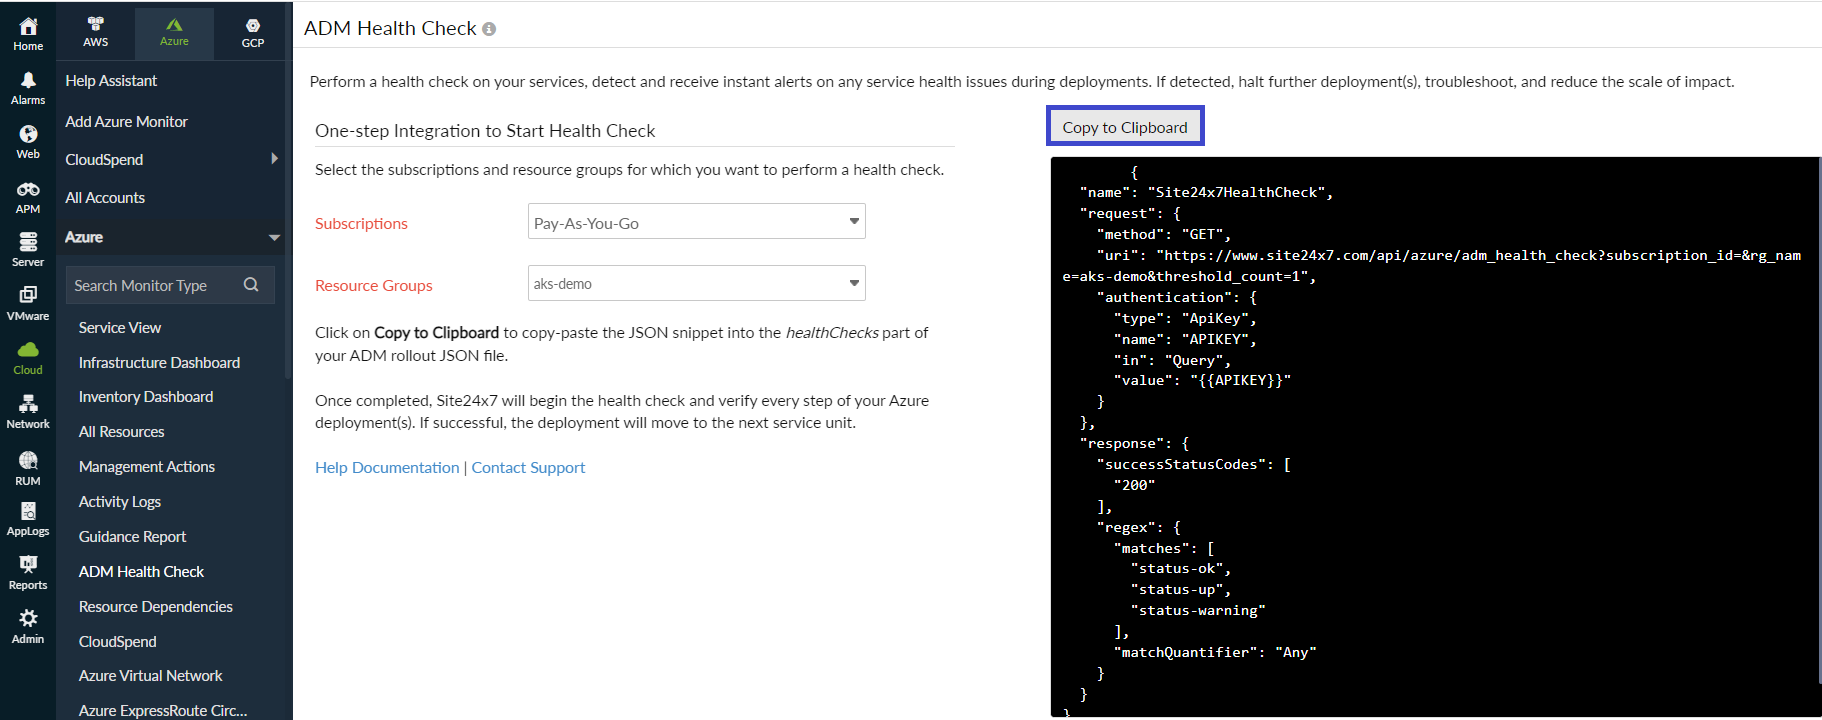
- Click on Copy to Clipboard to copy the JSON snippet.
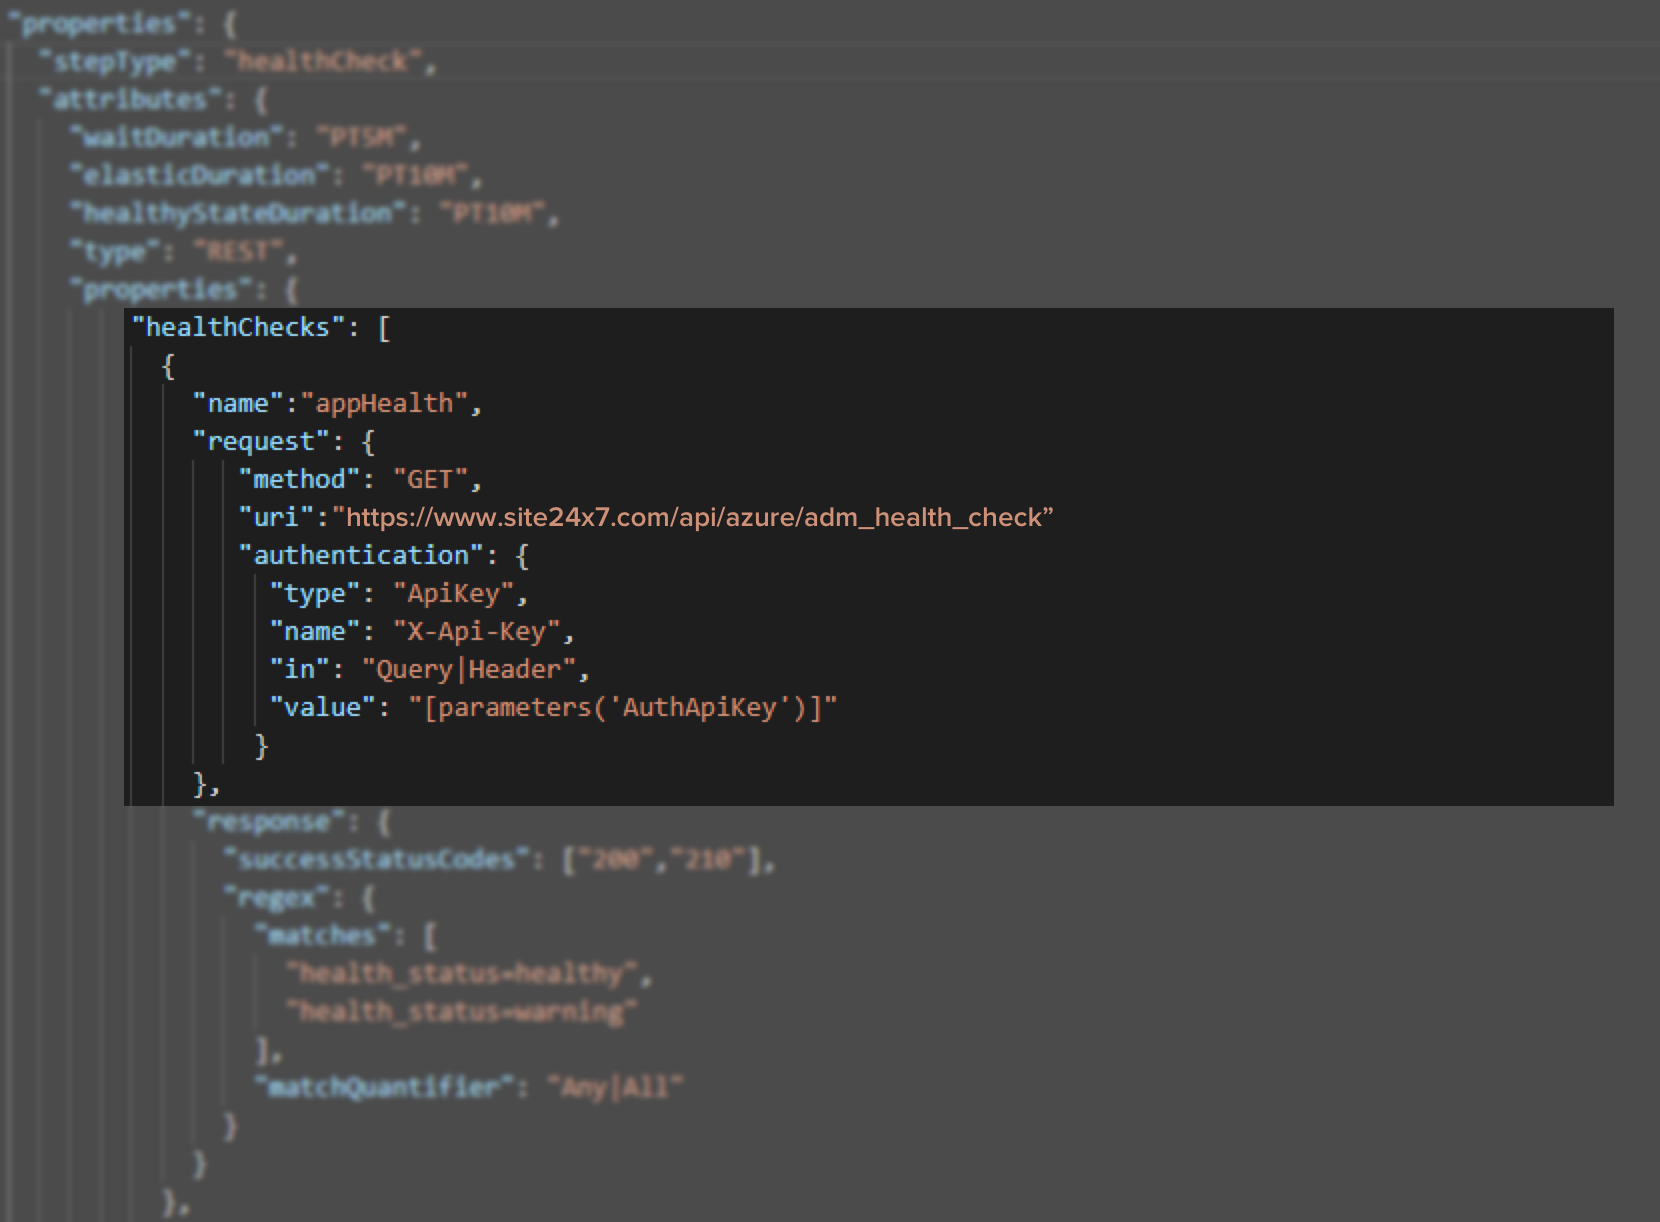
- Paste the copied JSON snippet into the healthChecks part of your ADM rollout JSON file.
Once completed, Site24x7 will begin the health check and verify every step of your Azure deployment(s). If successful, the deployment will move to the next service unit. If any issue is detected, Azure will stop the deployment and let you troubleshoot and reduce the scale of impact.
Security
Site24x7 Azure monitoring is done using the OpenID Connect Authentication, an approved workflow by Microsoft. The Azure resources are discovered and monitored using the global application, Site24x7 App, that is maintained in Site24x7's Microsoft account.
Level of access Site24x7 App has in your Azure environment:
When you click on Grant Access to your Azure Account, a login request is initiated to Microsoft Azure using the Site24x7 App's Client ID and Secret Key. This is done using the OAuth 2 APIs. The prerequisites for the OpenID Connect Authentication includes logging in to your Microsoft Azure account that has access to the Active Directory tenant and Owner role for the subscription that needs to be monitored. Once your Microsoft credentials are entered in the Azure login page, the Site24x7 App will request for the permission, Delegated Permissions - Sign you in and read your profile and Access Azure Service Management as you (preview). This delegated permission is required to register the Site24x7 App in your Azure Active Directory. The Azure Graph APIs are used to register the Site24x7 App.
Role Access in your Azure Subscriptions:
In the Add Azure Monitor page, you will have to choose either the Reader or Contributor role to start monitoring the Azure resources. If you choose the Reader role, the Site24x7 App will only be able to collect the inventory details and performance metrics for your Azure subscription(s). On the other hand, if the Contributor role is assigned, the Site24x7 App will be able to collect inventory details, performance metrics for your Azure subscription(s), and perform the following write actions:
- Start VM(s)
- Stop VM(s)
- Install the Site24x7 VM agent extension for Windows and Linux
Once the Site24x7 App is successfully registered and given the required permissions, the resources are discovered using the Azure Management APIs and performance metrics are collected using the Azure Monitor REST API. Since the API calls are used to fetch the metrics, all these API calls need authentication to get succeeded. Thus, Site24x7 needs access to use these APIs as a user.
List of Azure Services Monitored by Site24x7
Site24x7 monitors 100+ Azure products including virtual machines, scale sets, storage accounts, IoT Hub, and Cosmos DB. View the list of Azure services that can be monitored by Site24x7 in our list of supported Azure services help document.
Licensing
The main Azure account consumes one basic monitor license. Every Azure resource/element uses up one basic monitor. For example, if you want to monitor an Azure account that has 10 resources, it will be consuming 11 basic monitors, as in:
- Main Azure account = 1 basic monitor
- 10 resources = 10 basic monitors
- Total = 11 basic monitors
If you have installed the server monitoring agent extension in your VMs, the VM will consume two basic monitors and the server monitor will consume two basic monitors.
FAQs
- Is it possible to monitor Azure if I don't have the permission to the main subscription of my Azure account?
- How does resource termination settings work for Azure?
- How will the newly added resource groups/service types, created in the Azure portal, be added for monitoring in the Site24x7 web client?
- Can I exclude certain Azure resource groups from monitoring by Site24x7?
- Why don't I see the newly discovered Azure resources in the Site24x7 web client?
- Why are some of the performance metrics for my Azure resources missing in the Site24x7 web client?
- On what basis are the Azure resources created as monitors in the Site24x7 web client?
- What will happen if I move an Azure resource from one subscription/resource group to another?
- How do I install the Site24x7 server monitoring agent extension, once my VM resources are discovered and added for monitoring?
For more questions, refer our complete list of Kbase articles.