Java monitoring is the process of monitoring the performance of your Java applications by tracking key Java virtual machine (JVM) metrics across various platforms and subsequently debugging errors to optimize the end-user experience.
Monitor Java application performance with the Site24x7 APM Insight monitoring tool to view slow SQL queries and distributed traces, get AI-powered alerts in the event of an outage, and customize instrumentation for the Java agent.
Proactively eliminate bottlenecks with Site24x7's Java monitoring tool.
Site24x7 APM Insight gives you a complete picture of java application performance. Track business critical transactions, spot application dependencies, and identify anomalies in real-time, thereby ensuring a seamless end-user experience.
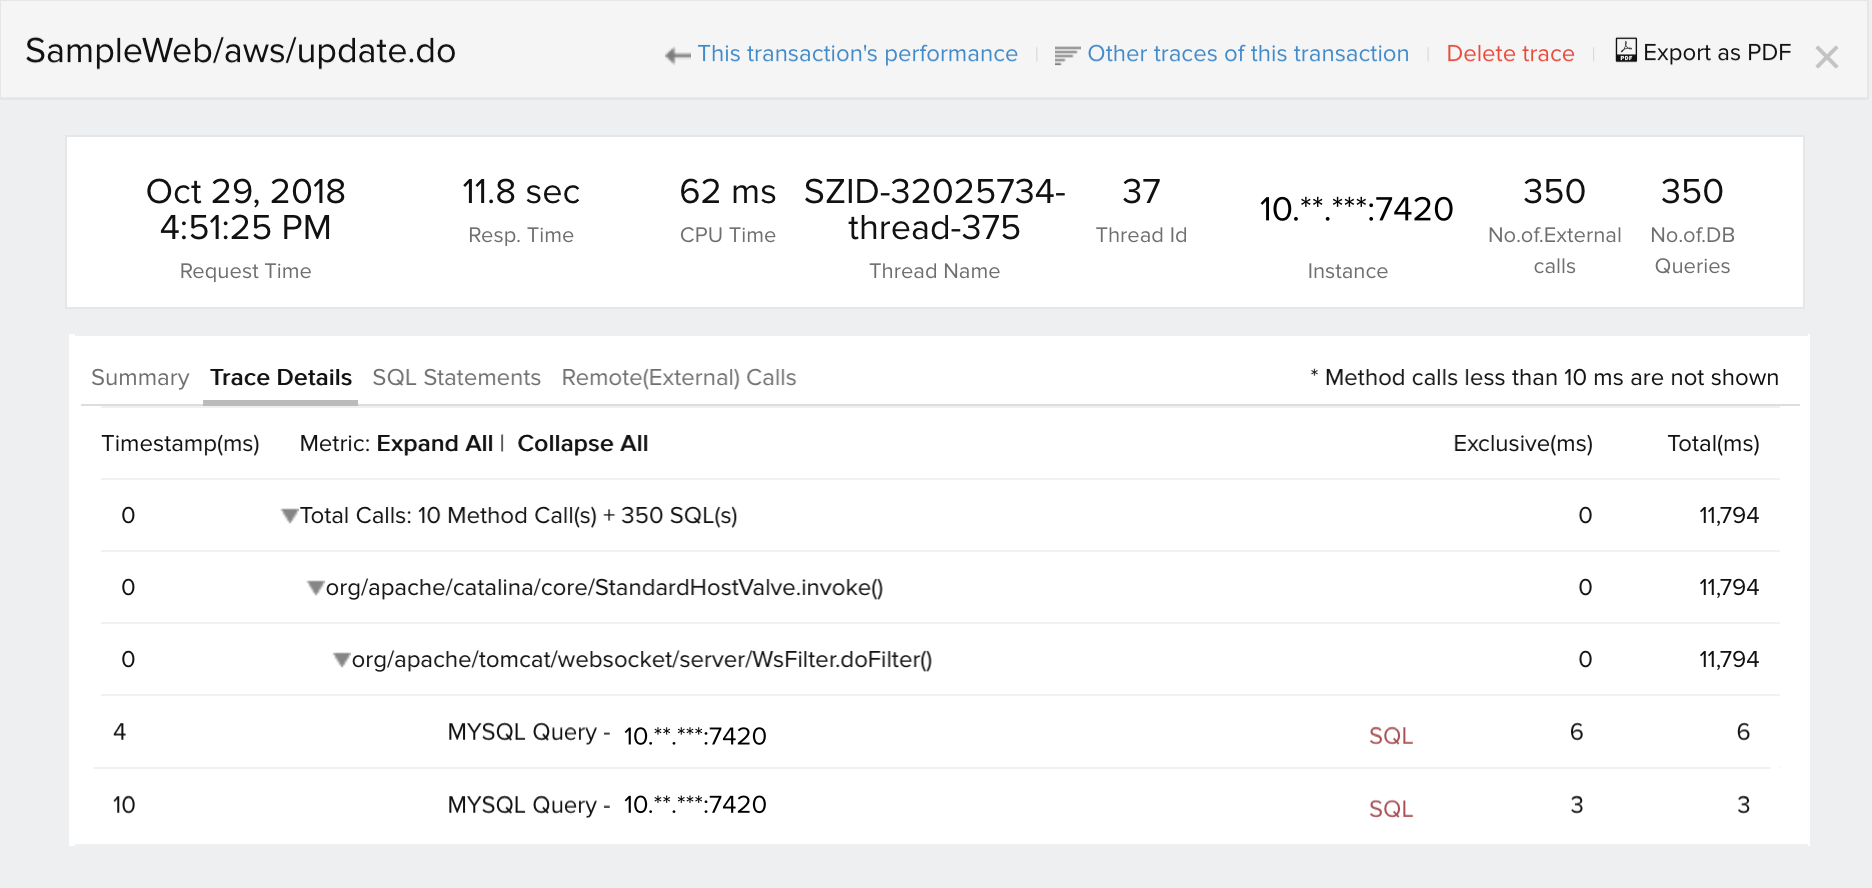
Identify slow traces.
Developers can easily identify slow internal invocations (methods) in the Java code and view the entire pathway in a tree view. The trace will chart the sequence of invocations of the URL inclusive of user defined methods.
You can also view the SQL queries involved in such transactions along with its stacktrace .
Evaluate performance of database calls.
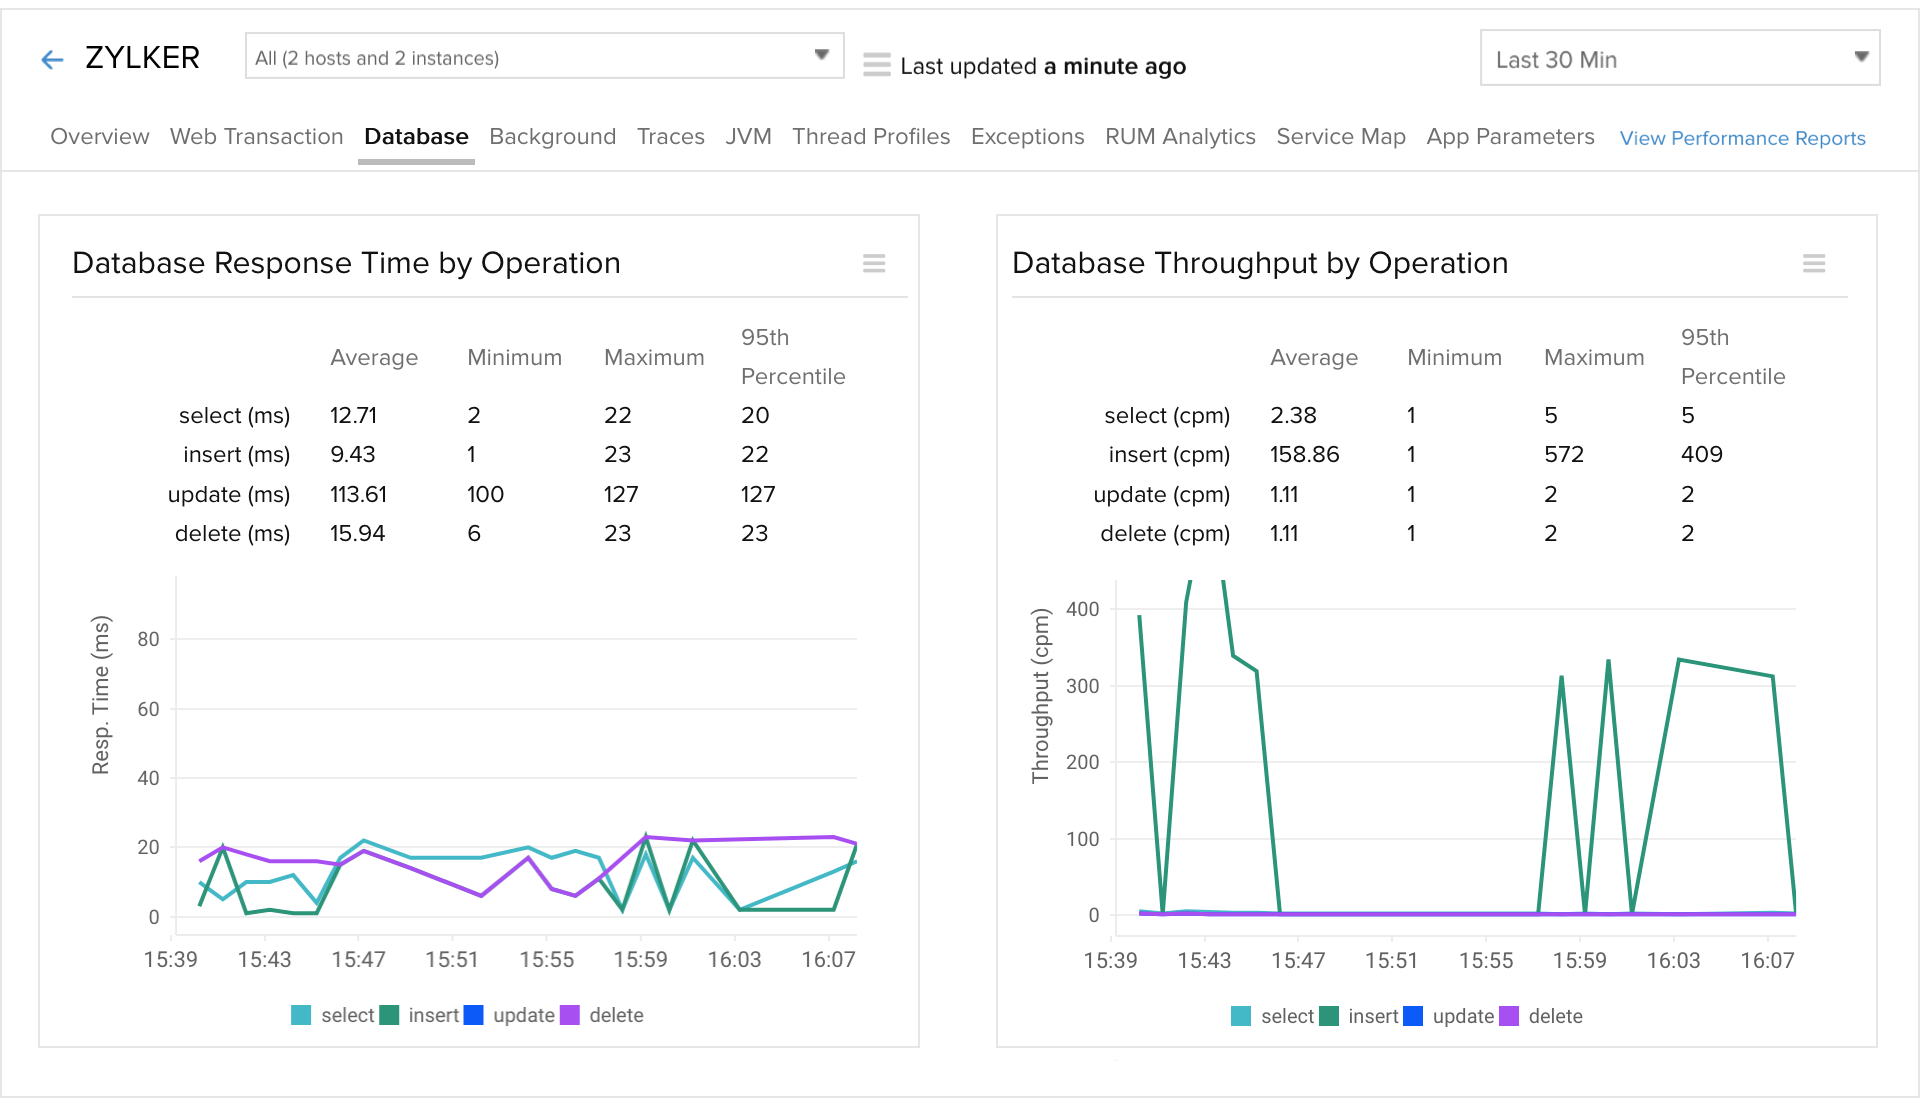
Opting to move a part of your database tables to in-memory cache like Memcached, Couchbase or Redis? Make your decision based on relevant data and stats such as:
- The most hit database tables.
- The busiest table and the most performed SQL Operation on the table.
- Web transactions issuing SQL calls.
- The most executed database operations with its response time.
Get detailed performance metrics to identify slow database calls, database usage and overall performance of the database furnished with detailed graphical and tabular representations.
Analyze your JVM metrics.
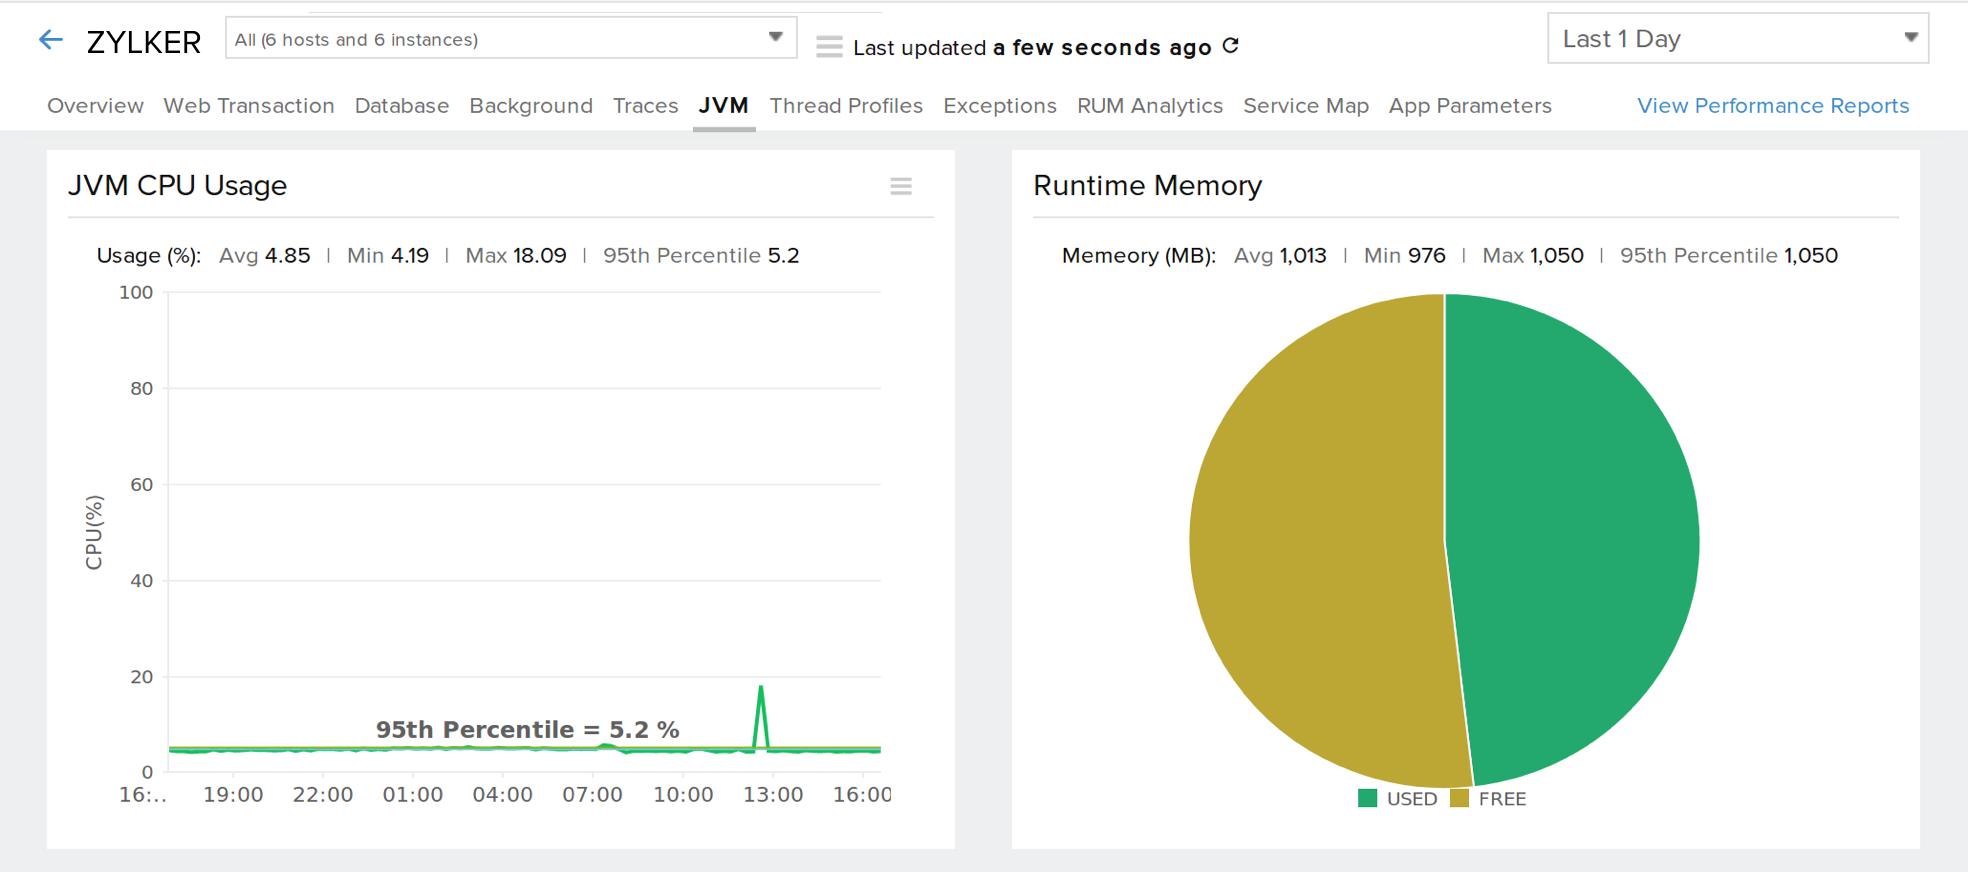
Monitor critical parameters of JVM like JVM CPU usage count, memory usage, GC count, GC time and thread summary. Configure threshold values for your JVM metrics and get alerted whenever there is an outage.
Monitor your custom Java components.
Develop wider insights into your applications and effortlessly track performance of specific features or modules. Custom Instrumentation for Java agent can be done either by using Java Annotations or through a Configuration File.
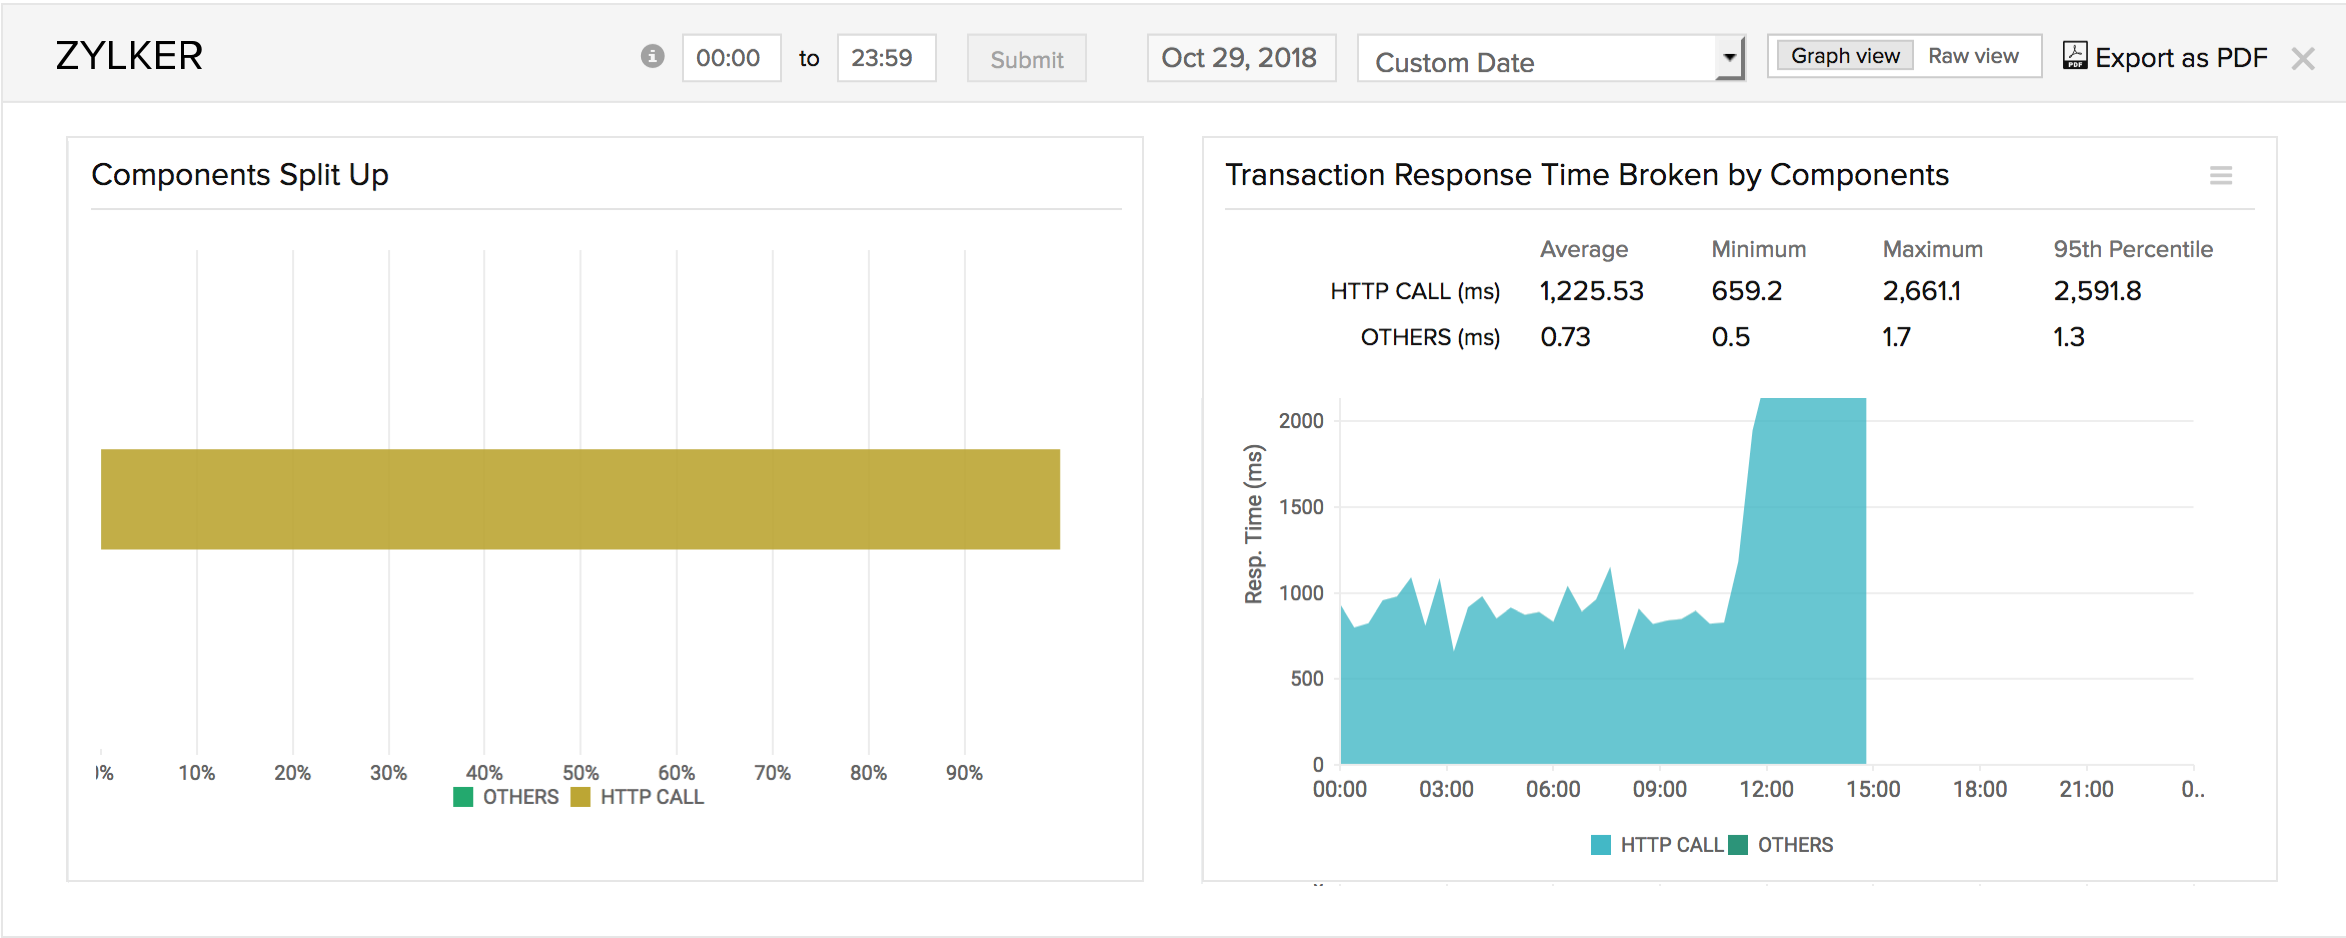
Track background transactions.
Apart from web transactions, track the various background tasks run by applications such as those associated with maintenance, schedulers, and messaging.
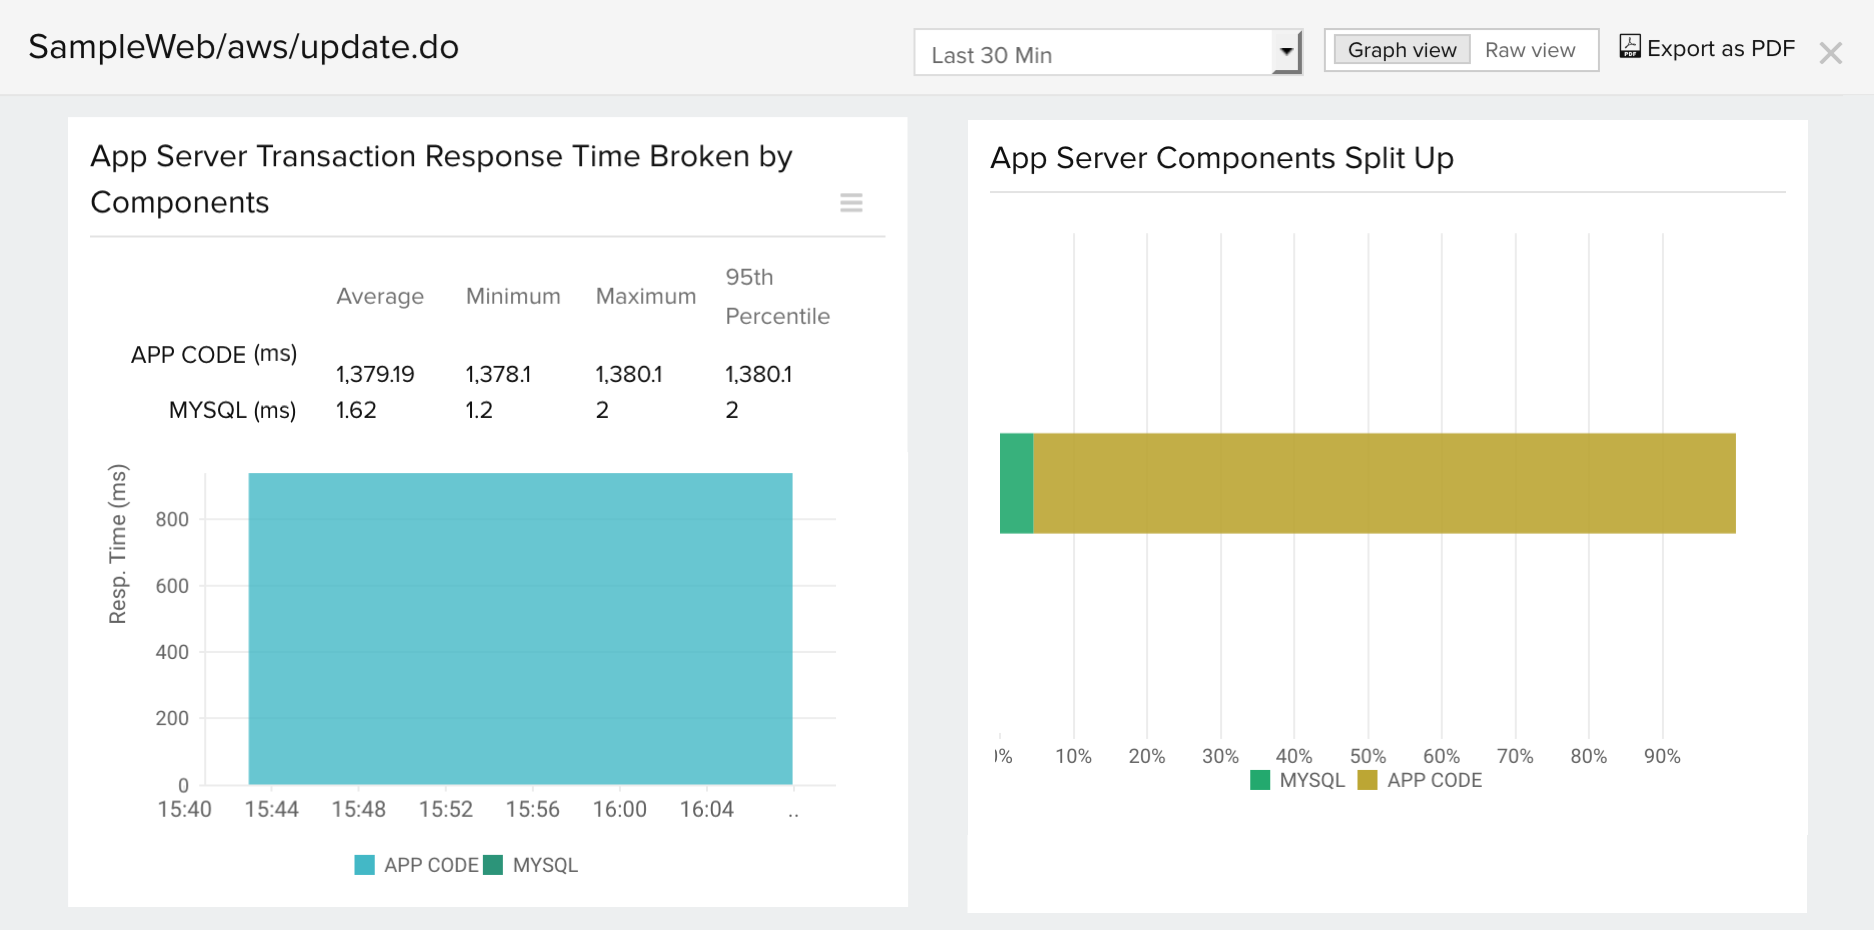
Additional features in Java APM
- With upto 15 different services supported, monitor all applications accessing your AWS environment.
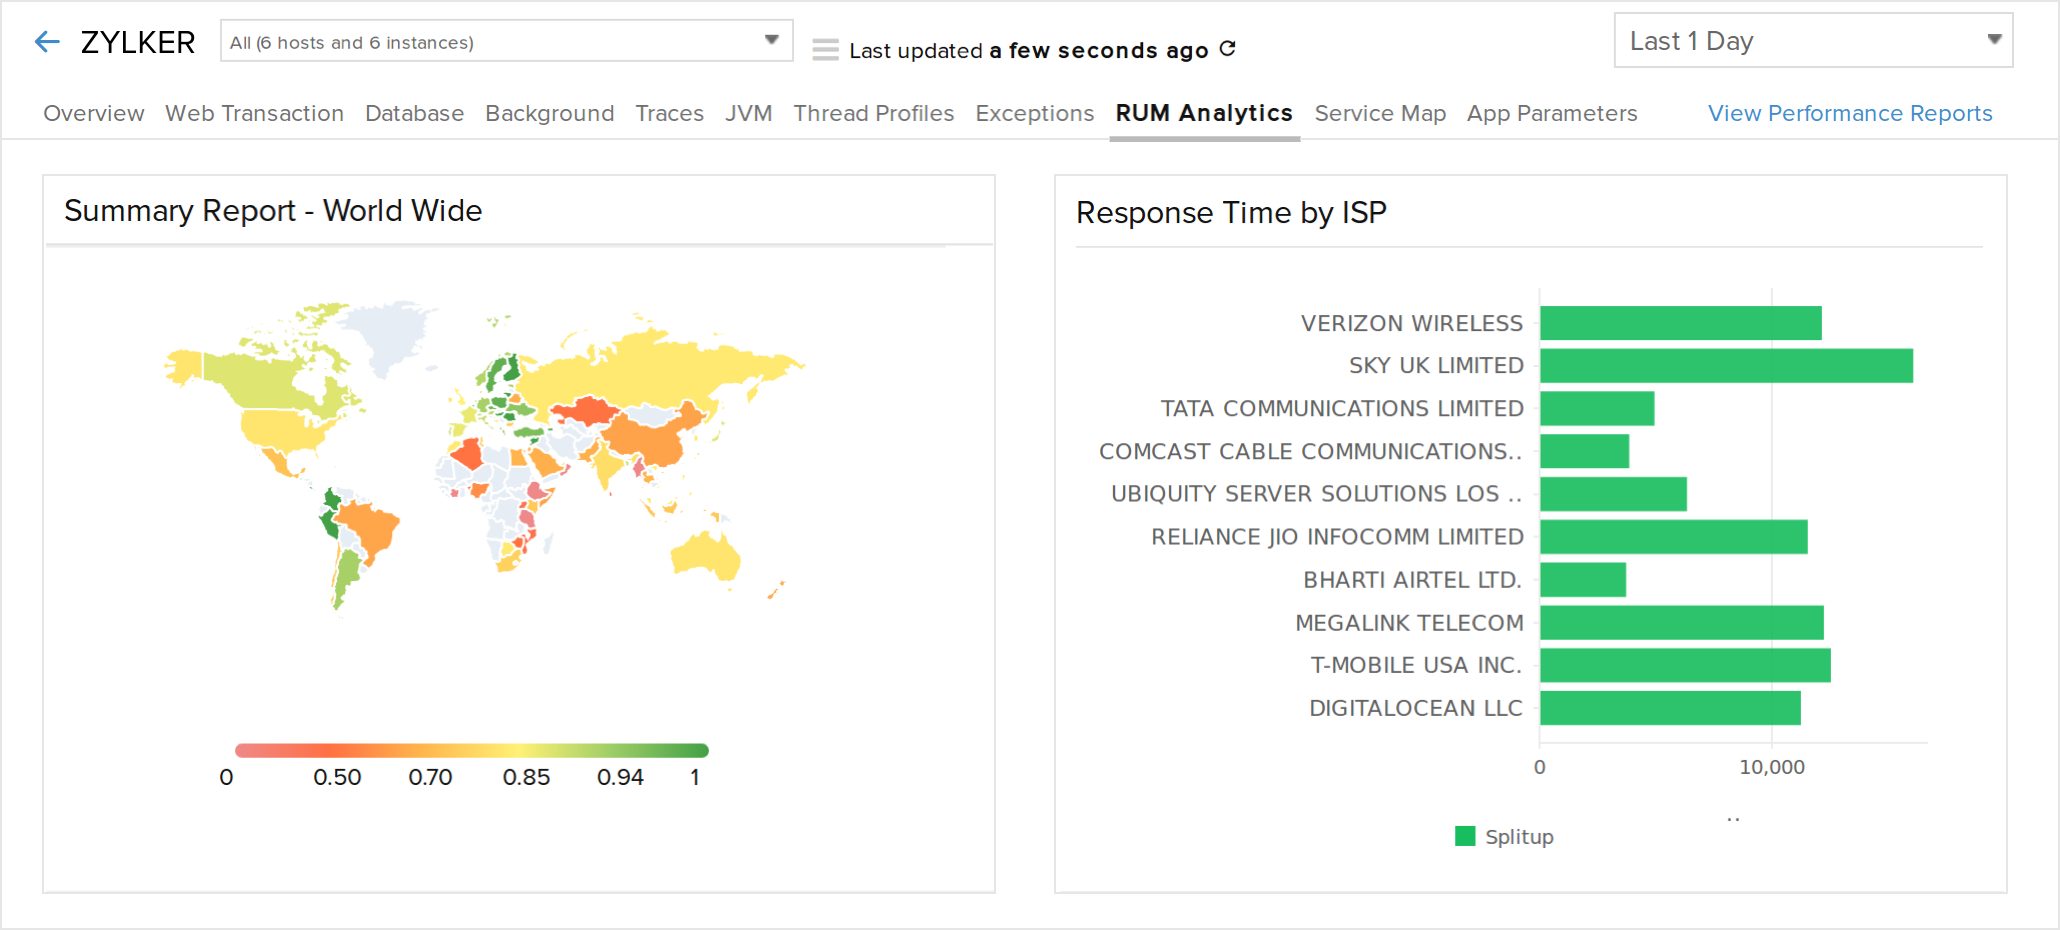
- Integrate APM Insight with RUM and enhance your end user experience.
- Combine APM Insight with Site24x7 Server Monitoring to increase your Java environment monitoring capabilities.
Site24x7's Java monitoring tool supports a wide variety of application servers.
An overview of Java monitoring
What is Java monitoring?
Java monitoring is the process of monitoring the performance of applications built using Java. It also refers to monitoring any servers that support Java applications. Java monitoring works by tracking key JVM metrics across various platforms, like Apache Tomcat, JBoss, GlassFish, and WildFly, and debugging errors to optimize the end-user experience.
Why is Java performance monitoring important?
Java performance monitoring helps you gain an in-depth understanding of the performance of your Java applications and deal with feature issues native to Java applications. For example, monitoring Java applications helps developers analyze JVM metrics, like JVM CPU and memory usage, to deal with crashes or slow performance. With Java monitoring, developers can streamline troubleshooting in the pre- and post-production stages of an application, use distributed tracing to identify the root cause of issues in a microservices architecture, and utilize service maps to analyze the impact of remote services like databases and cache on the java application.
How does a Java application monitoring tool work?
Java applications have built-in tools, like JProfiler and VisualVM, to aid in monitoring their performance. However, these tools do not help with troubleshooting errors, debugging slowness, or pinpointing a method that is causing issues.
In order to monitor method-level performance, instrumentation is performed by marking the start and end time of a method to acquire inputs on the time spent on it. Other important metrics like arguments passed or SQL queries can also be collected. The gathered information can be placed collectively under a request or API that is being processed and can be used to monitor the performance of your Java application.
What are the benefits of having a Java monitoring tool?
A Java application performance monitor helps you track various metrics that are unique to your Java application, like the JVM CPU usage count, memory utilization, garbage collection count and time, and thread summary, in real time. You can identify slow traces to augment anomaly detection. You can also get AI-powered alerts to monitor proactively and use JMX metrics to manage and enhance the performance of your Java application.
Why should you choose Site24x7 as your Java performance monitoring tool?
Site24x7's Java performance monitoring tool not only aids in standard response time tracking but also provides distributed tracing to track a single request hopping between various microservices. Our Java monitoring tool allows you to integrate with external servers, like databases and web services, to show performance data. It can also be combined with Site24x7's server monitoring to increase your Java application environment's monitoring capabilities.

