Resource Explorer
Resource Explorer enables you to group and view your costs by accounts, region, service, or even tags. With Resource Explorer, you can easily gain in-depth analysis of how each AWS resource is consuming your cloud cost. The AWS bills are parsed for the specified custom timeline for which the cloud spending is displayed. Key pointers to remember:
- Obtain paginated cost views of all resources in your AWS bill. Use the search bar to query individual resource cost for a day, month, quarter, or year.
- View a stacked area chart to view the daily spending pattern if the period is less than a month.
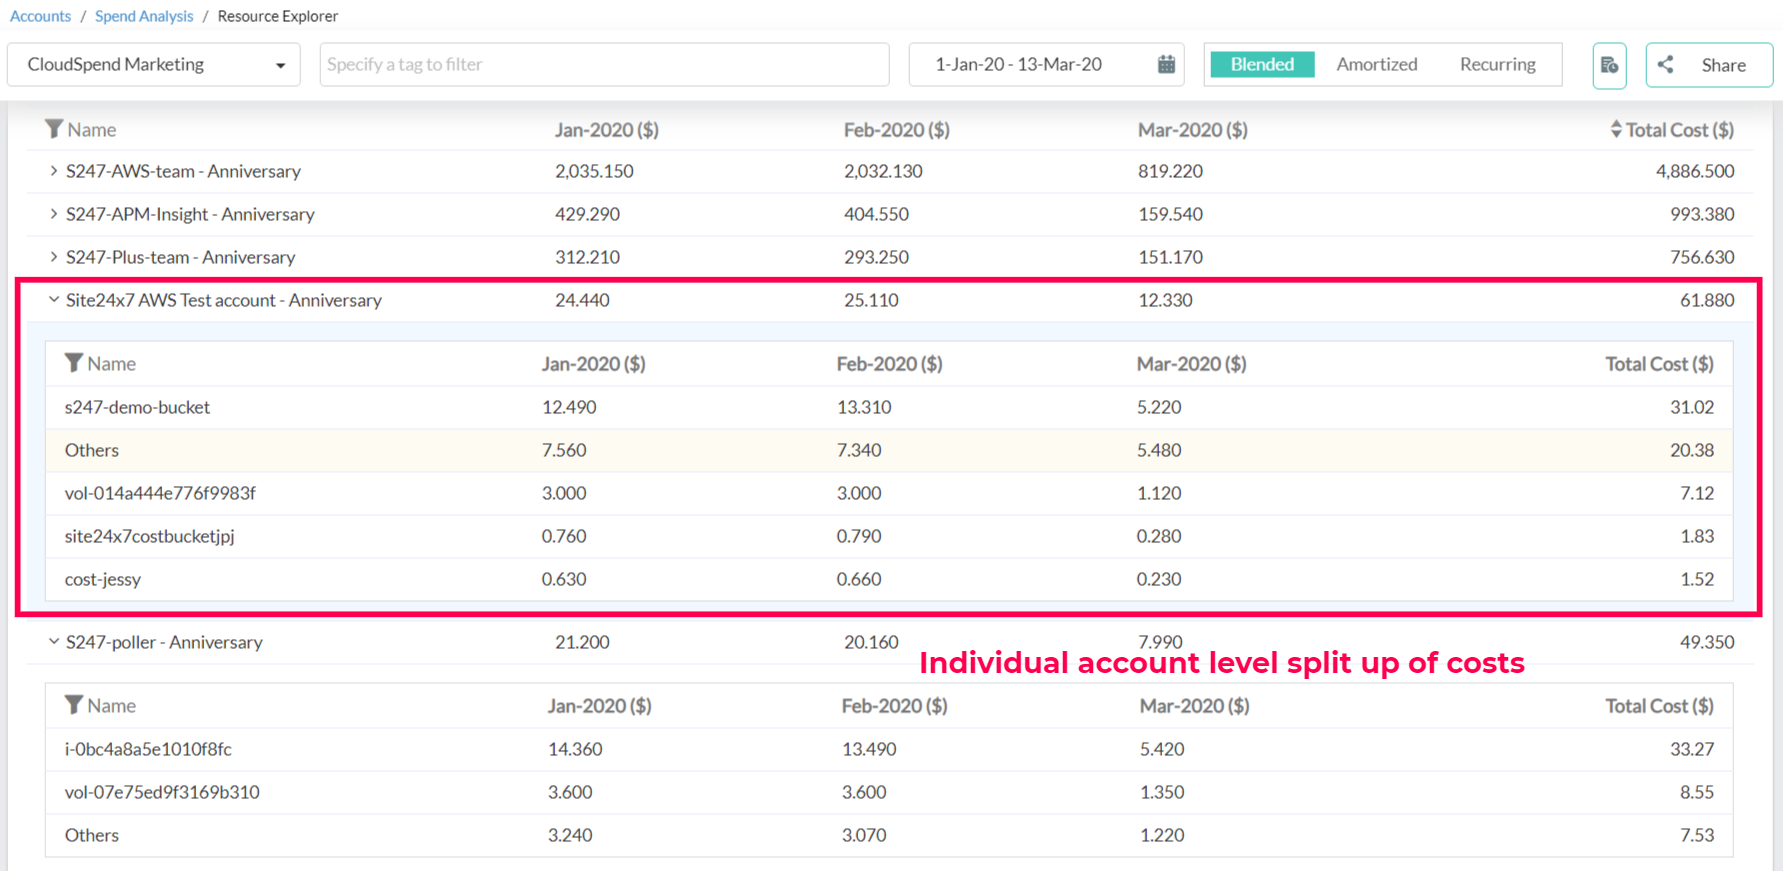
- Obtain a responsive table to view the cost split up based on the account, region, or service when the period selected is more than ten days or ten months.
Table of contents
How does Resource Explorer work
With Resource Explorer, you can view how and where your cloud costs are spent, facilitating slice-and-dice reporting. Granular reporting lets you gain deep insights into your Amazon Web Services (AWS) bills. Resource Explorer offers various features, including:
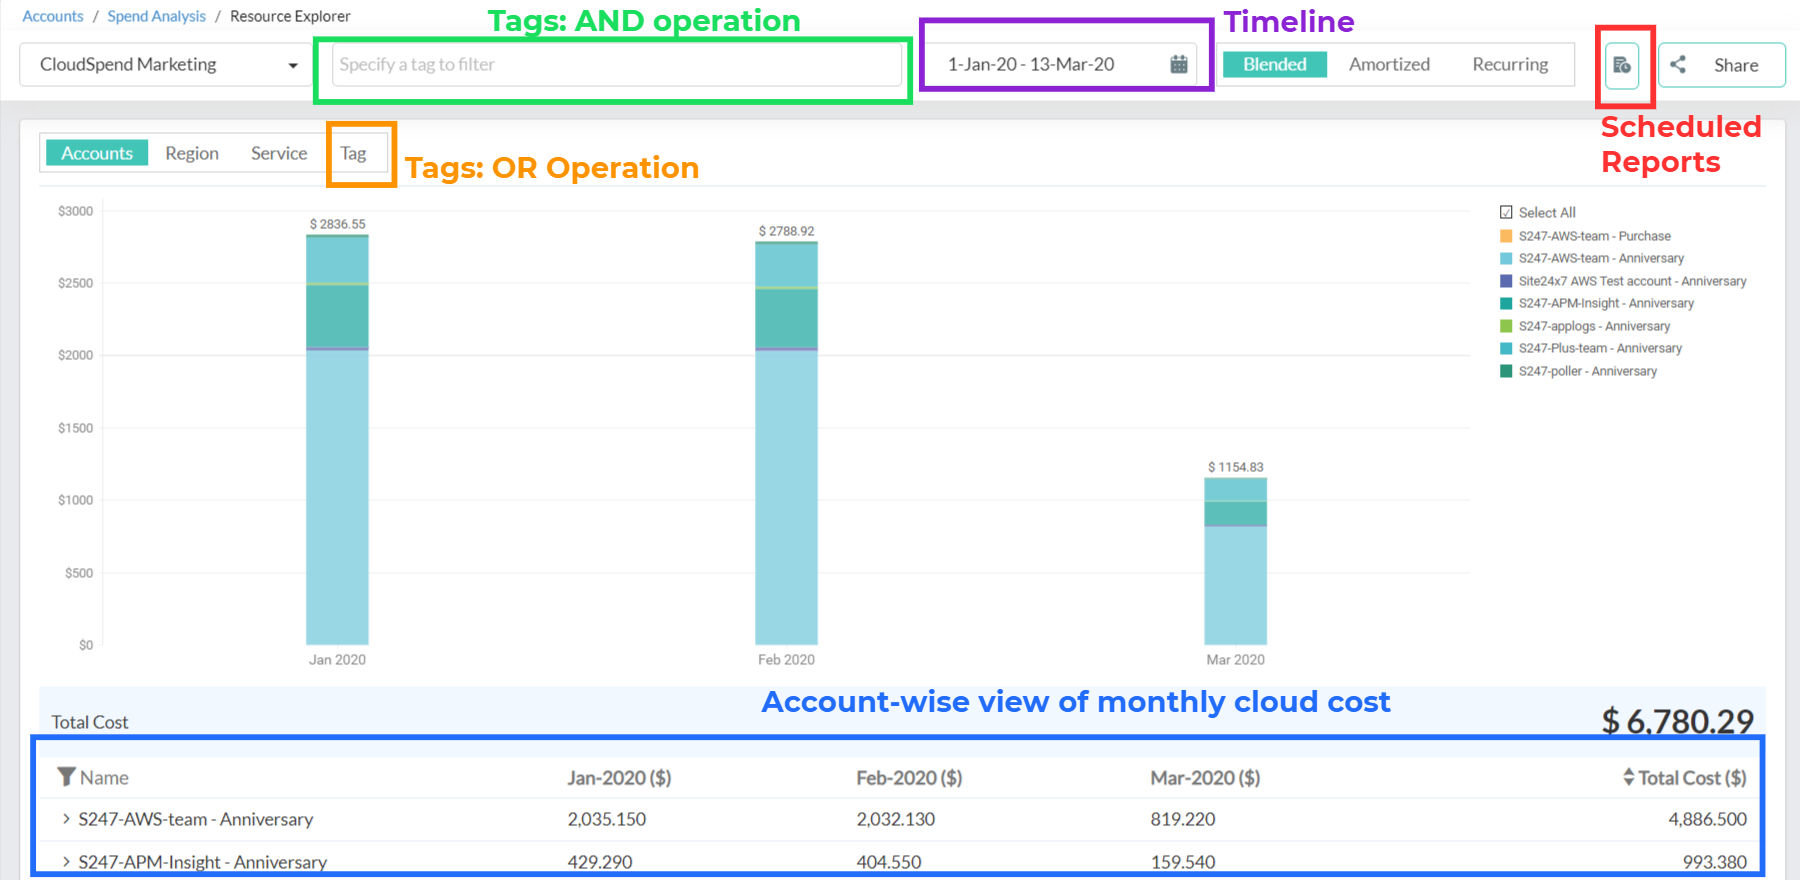
- Timeline:You can view the cloud spending from today, the previous day, the last 7 days, the last 30 days, or a custom date range.
- Tags: AND operation:The top tags field can be used to specify tags based on default attributes such as the usage type, service name, operation type, usage info, region name, created by, name, instance type, user, availability zone, and data transfer type. The tags can be used in combination to perform an AND operation and retrieve the costs for an account, region, or service. Furthermore, you can add or edit a custom label by clicking +Tag Profile in the top-right corner.
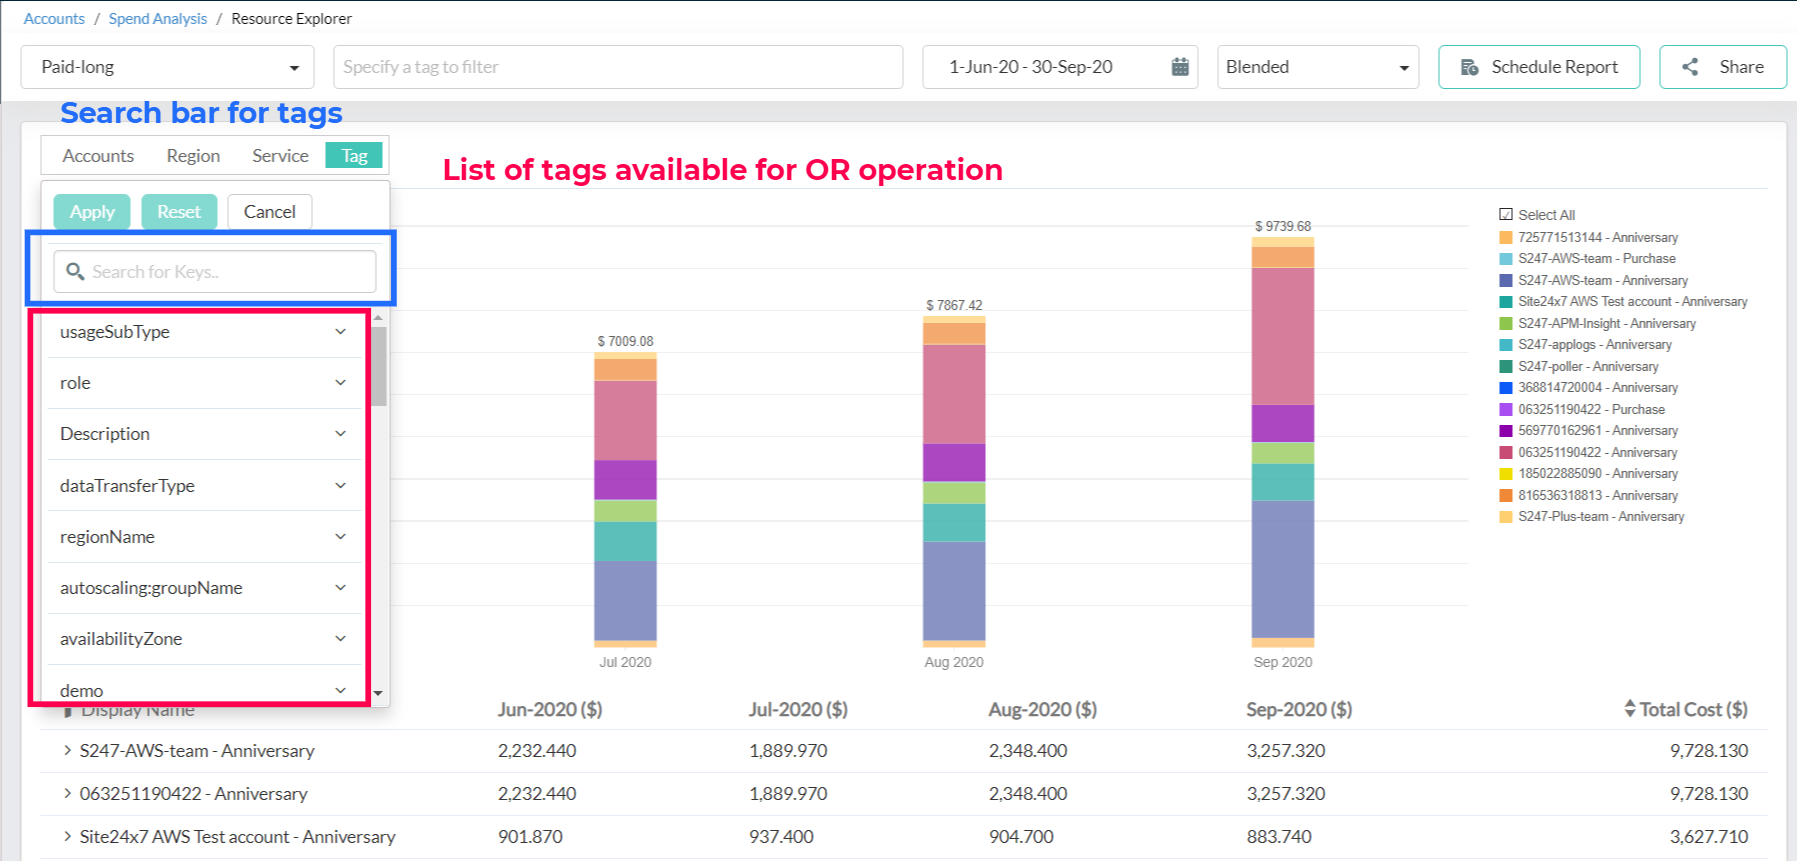
- Tags: OR operation:The bottom row of tags lets you select various default tags to be used in combination to perform an OR operation. Select the necessary tags from the drop-down, and click Apply.
- Scheduled reports: Besides grouping the costs based on account, service, or region on a single screen, you can get them delivered to your inbox on a monthly, quarterly, or yearly basis.
- Account-wise view:The cost view can be obtained account-wise, service-wise, or region-wise based on how you navigate to the Resource Explorer view.
How to navigate to the Resource Explorer
You can access the Resource Explorer view from three sections:
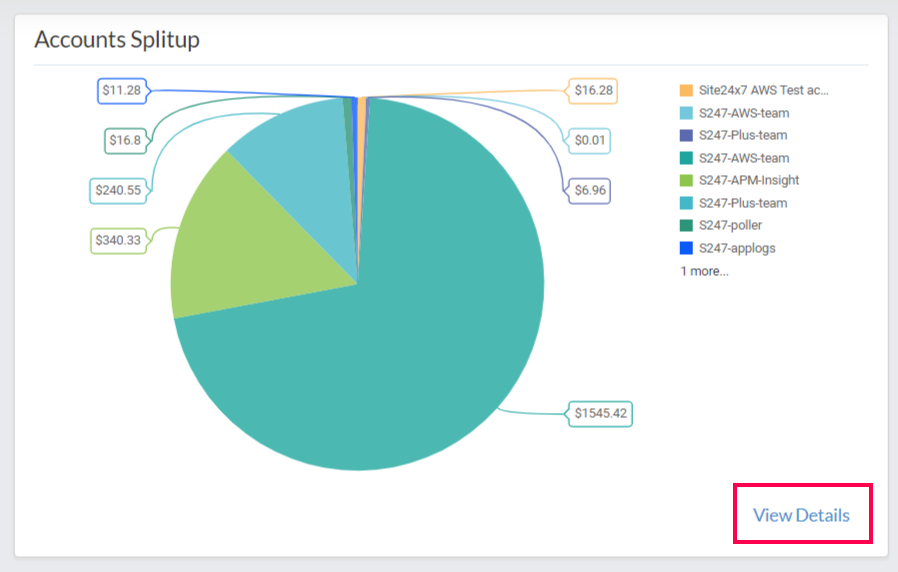
1. Accounts Splitup page
The Accounts Splitup view provides the cloud cost based on the various billing accounts added to your CloudSpend. From the Spend Analysis tab, navigate to the Accounts Splitup section, and click View Details to access the Resource Explorer.
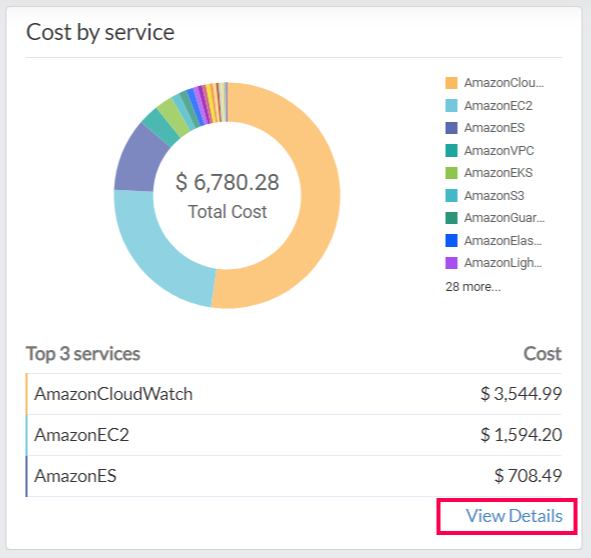
2. Cost by service
The Cost by service view displays the top three services that have accrued the highest AWS charges. On hovering above each service displayed on the pie chart, you can see the service-wise splitup of costs. From the Spend Analysis tab, navigate to the Cost by service section, and click View Details.This provides you a holistic view of all the services in your AWS infrastructure and the corresponding bills for each month.
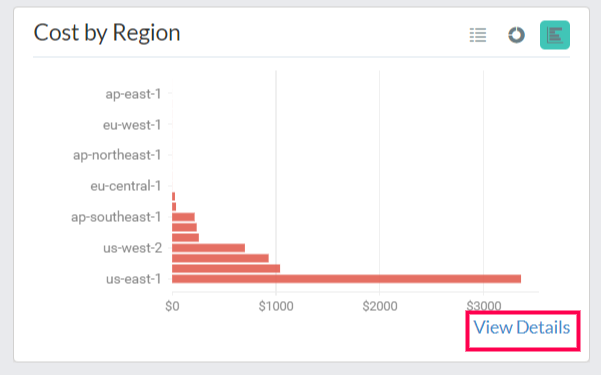
3. Cost by region
From the Spend Analysis tab, navigate to the Cost by Region section, and click View Details.
Forecast
The forecasting feature enables you to predict cloud bills based on the historical observations. To predict the cloud bill for the next 90 days, it requires the historical data of the past 90 days. The cost exchange rate for forecasting is applied for future months based on the current month rate.
A red up or green down arrow is displayed based on the comparison between the previous and current months' cloud costs. If the forecasted value is high, a red up arrow is displayed against the forecasted cloud cost. If the forecasted value is low, a green down arrow is displayed next to the forecasted cloud cost. When the forecasted cloud cost is the same as current cost, a dash (-) is displayed. A forecast graph is displayed only for cost data up to the current date.
You can view the forecast data in the:
- Accounts dashboard.
- Business Unit dashboard.
- Budget Details page.
- Resource Explorer view.
For the Accounts and Business Unit dashboards, the red up or green down arrow next to the forecast value shows the forecast for the current month based on the previous month's data. The percentage value shown is calculated using the following formula:
|
Forecast value percentage = (Forecasted cost - Previous month cost) / Previous month cost |
You can view the forecasted budgeted value in a progress bar against the budgeted value. For the Resource Explorer forecasts, red up and green down arrows next to the forecast value are displayed based on the Last Month cost vs. the Forecasted Current Month cost. The Forecast Data page displays the up-to-date cost vs. the 90 days forecasted data based on the aggregated period type used daily in a graph as well as a table.
