Monitoring tabular performance counters
You can monitor the tabular SNMP OIDs of your network devices using tabular performance counters. Categorize and view all your group-based performance metrics in a unified table right in Site24x7.
In this doc we'll cover:
- Use cases for tabular performance counters
- Adding tabular performance counters
- Editing the threshold of tabular performance counters
- Testing tabular performance counters
- Viewing performance reports
- Deleting tabular performance counters
What are tabular performance counters used for?
They monitor tabular OIDs. Take a look at some use cases to better understand tabular performance counters.
How do I add tabular performance counters?
You can add tabular performance counters in a few different ways:
- While adding device templates
- While editing device templates
- From the Performance Counters tab
- From the Tabular Performance Counters tab
To add tabular performance counters while adding device templates:
Log into your Site24x7 account and navigate to Network > Device Templates. In the Device Templates screen, click Add Device Template, located at the top right corner of the screen and enter the following:
- Device Template: Provide a name to identify the template.
- Share this template globally with other Site24x7 users: Toggle Yes if you wish to share your custom template across Site24x7 users.
- Vendor: Pick a vendor from the drop-down menu or add one by clicking +.
- Category: Choose the category to which the device belongs to. You can also add a new custom category by clicking +. In this case, you'll have to add a Parent Category first, and then the custom Category will be a sub-type of the Parent.
- Device Identifier: Enter the System Object Identifier (SysOID).
- Performance Counters: To add custom performance counters, click the button. Click on the Tabular tab.
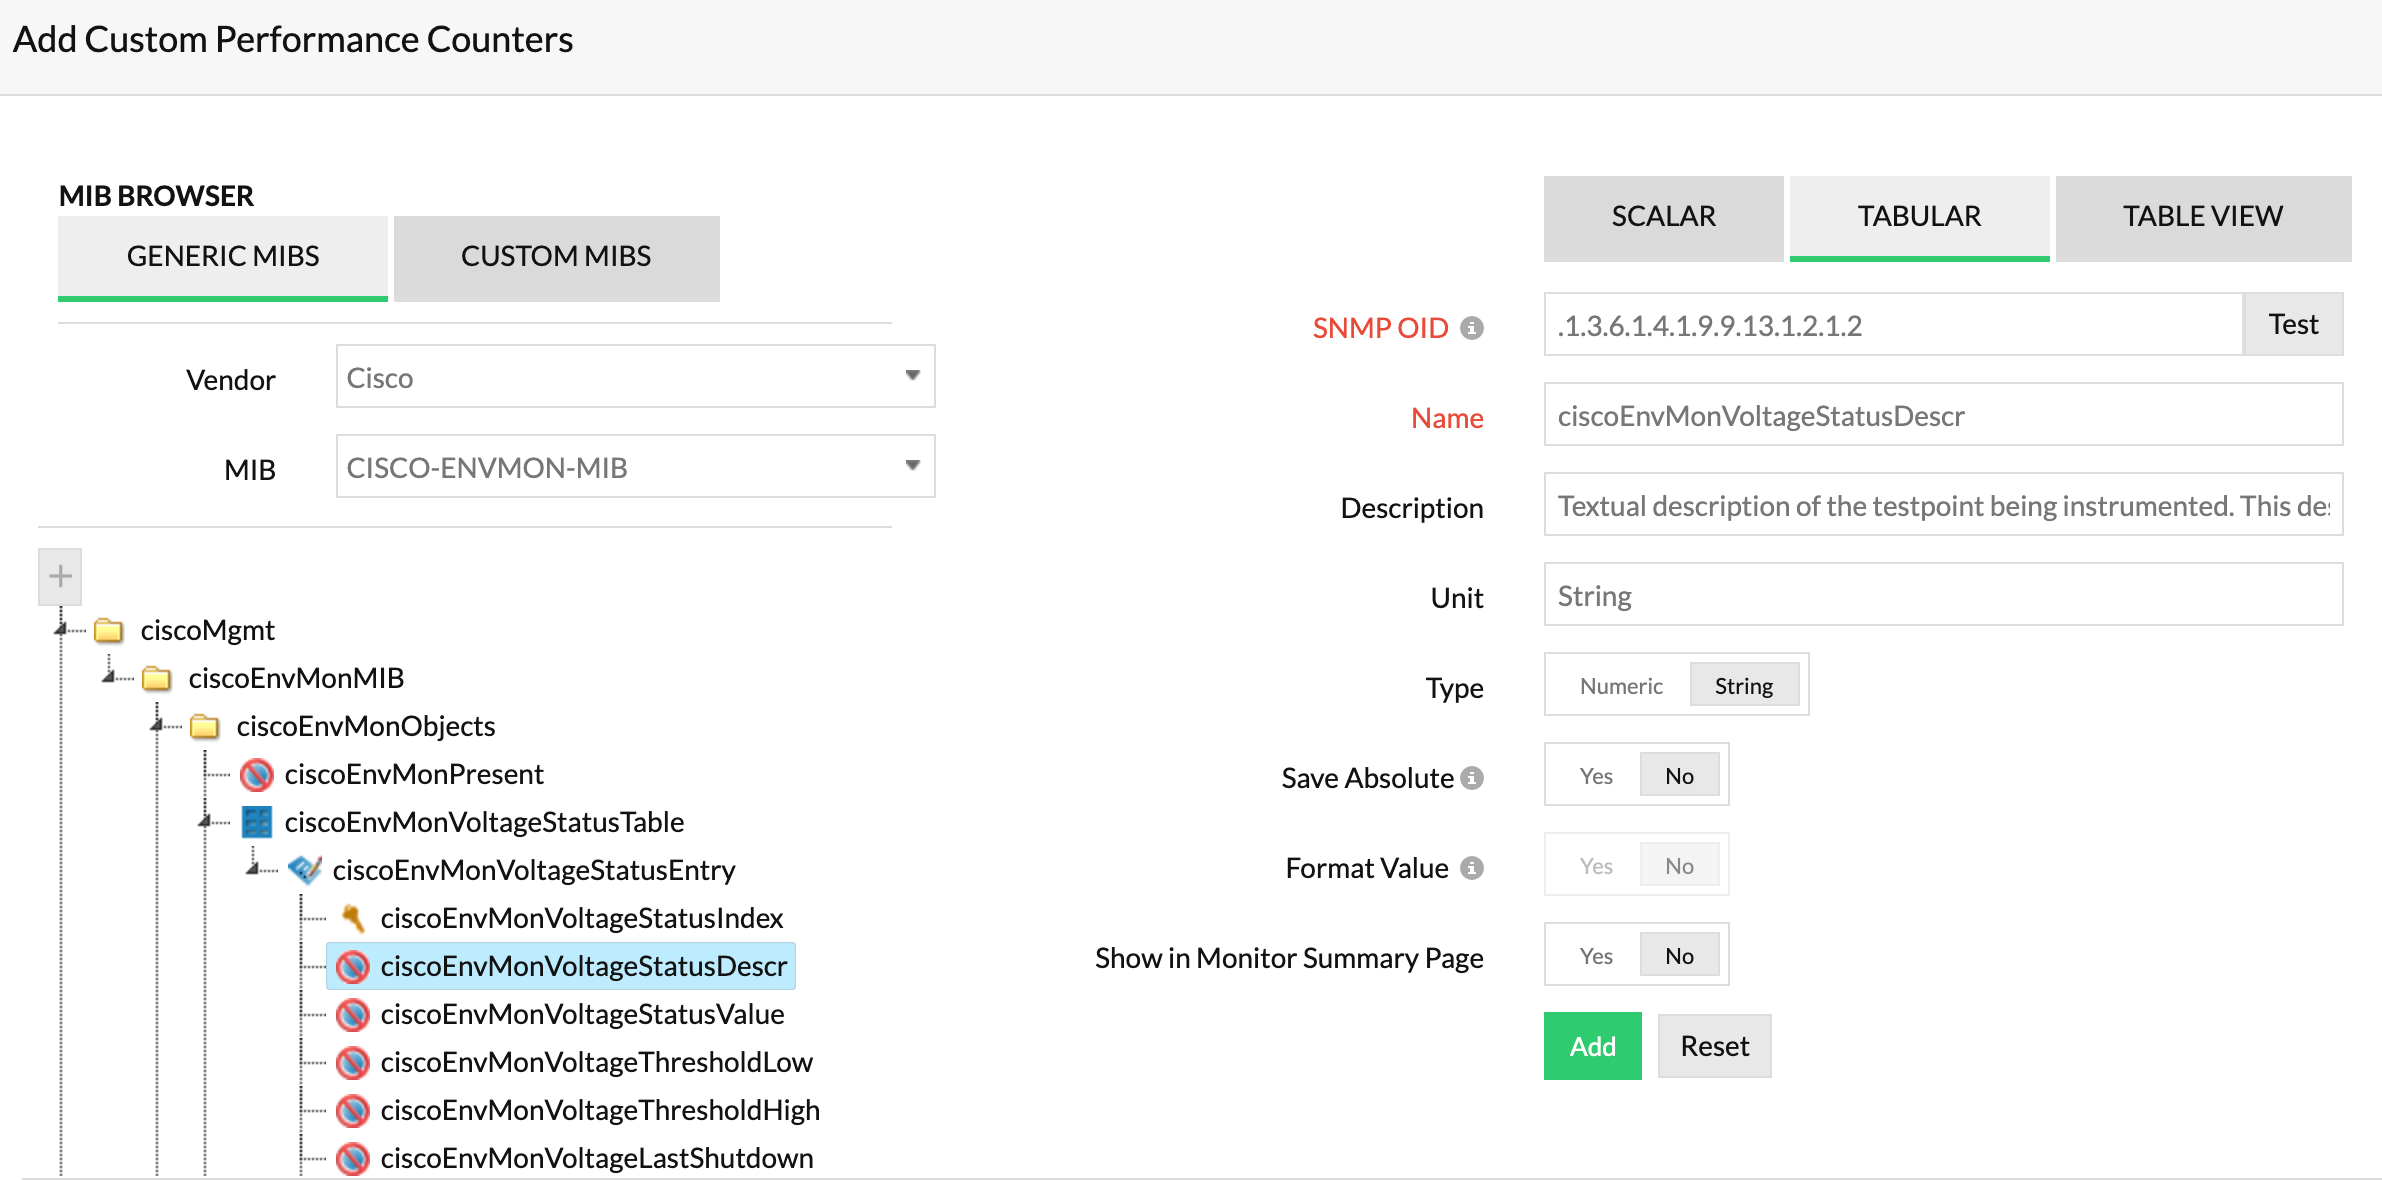
- MIB Browser: Choose if you wish to add performance counters from generic MIB or custom MIBSs.
- Generic MIBs: These are available by default in Site24x7. Choose the Vendor and the MIB from the drop-down list.
- Custom MIBs: You can upload MIBs from your system and use them to add custom performance counters.
- On-Premise Poller: Choosing an On-Premise Poller will list all the MIBs inside the folder Poller-home/NetworkPlus/mibs. Choose the On-Premise Poller which stores the MIB files you uploaded. If you choose ‘Recently Viewed’, all the MIBs that were uploaded or recently used will be shown.
- MIB: Choose an already uploaded MIB from the drop-down menu or click + to add new ones.
In the Upload MIB screen, select files and upload them from your computer. Also, choose the On-Premise Poller which has to store the MIB files.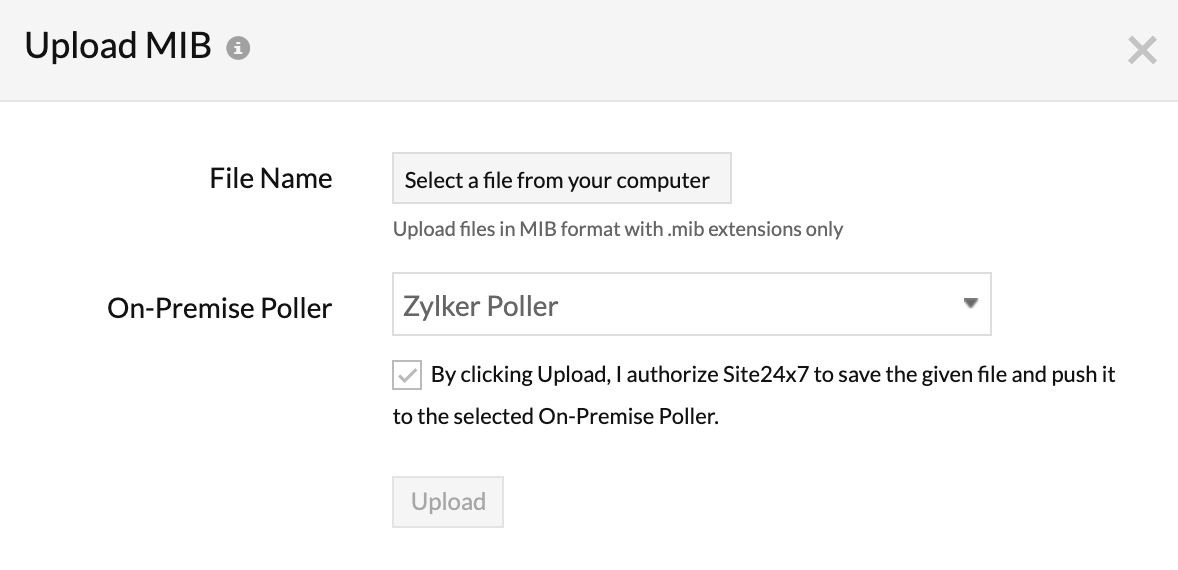
- Generic MIBs: These are available by default in Site24x7. Choose the Vendor and the MIB from the drop-down list.
- Tabular Performance Counters: Add tabular performance counters by entering the values for SNMP OID, name, description, unit, type, and format value. You can either enter them manually or use the in-built MIB browser to do the same. By selecting a table on the MIB, you can directly create a Table View which includes all the corresponding tabular performance counters.
Save Absolute: This option is available for scalar and tabular performance counters and is useful for counter type OIDs. When toggled to No, this will fetch the value as the difference between the last two polls. To fetch the value from all data procured, toggle to Yes. - Table View: A table view displays selected performance counters as a table. Provide a name, and choose the tabular performance counters that have to be displayed as individual columns in a table. You can also choose a table directly from the MIB and view it, here. Note that a table can contain at the maximum of nine columns while the rest will be added as individual tabular performance counters.
Column of the Table View to be displayed in the Alert: Choose a column name to include in the alerts generated so that you'll obtain a clear picture of which tabular performance counter in the table has generated alert.
e.g. Consider a table View with two tabular performance counters (columns) namely "Sensor Failures" and "Sensor Description". If you choose the column "Sensor Description", then your alert will be like: Sensor Failures-.3 for (Power Supply 2 Sensor) exceeds 5 units. - Show in Monitor Summary Page: Toggle yes to choose if the performance counter has to be displayed on the monitor summary page.
- Click Add.
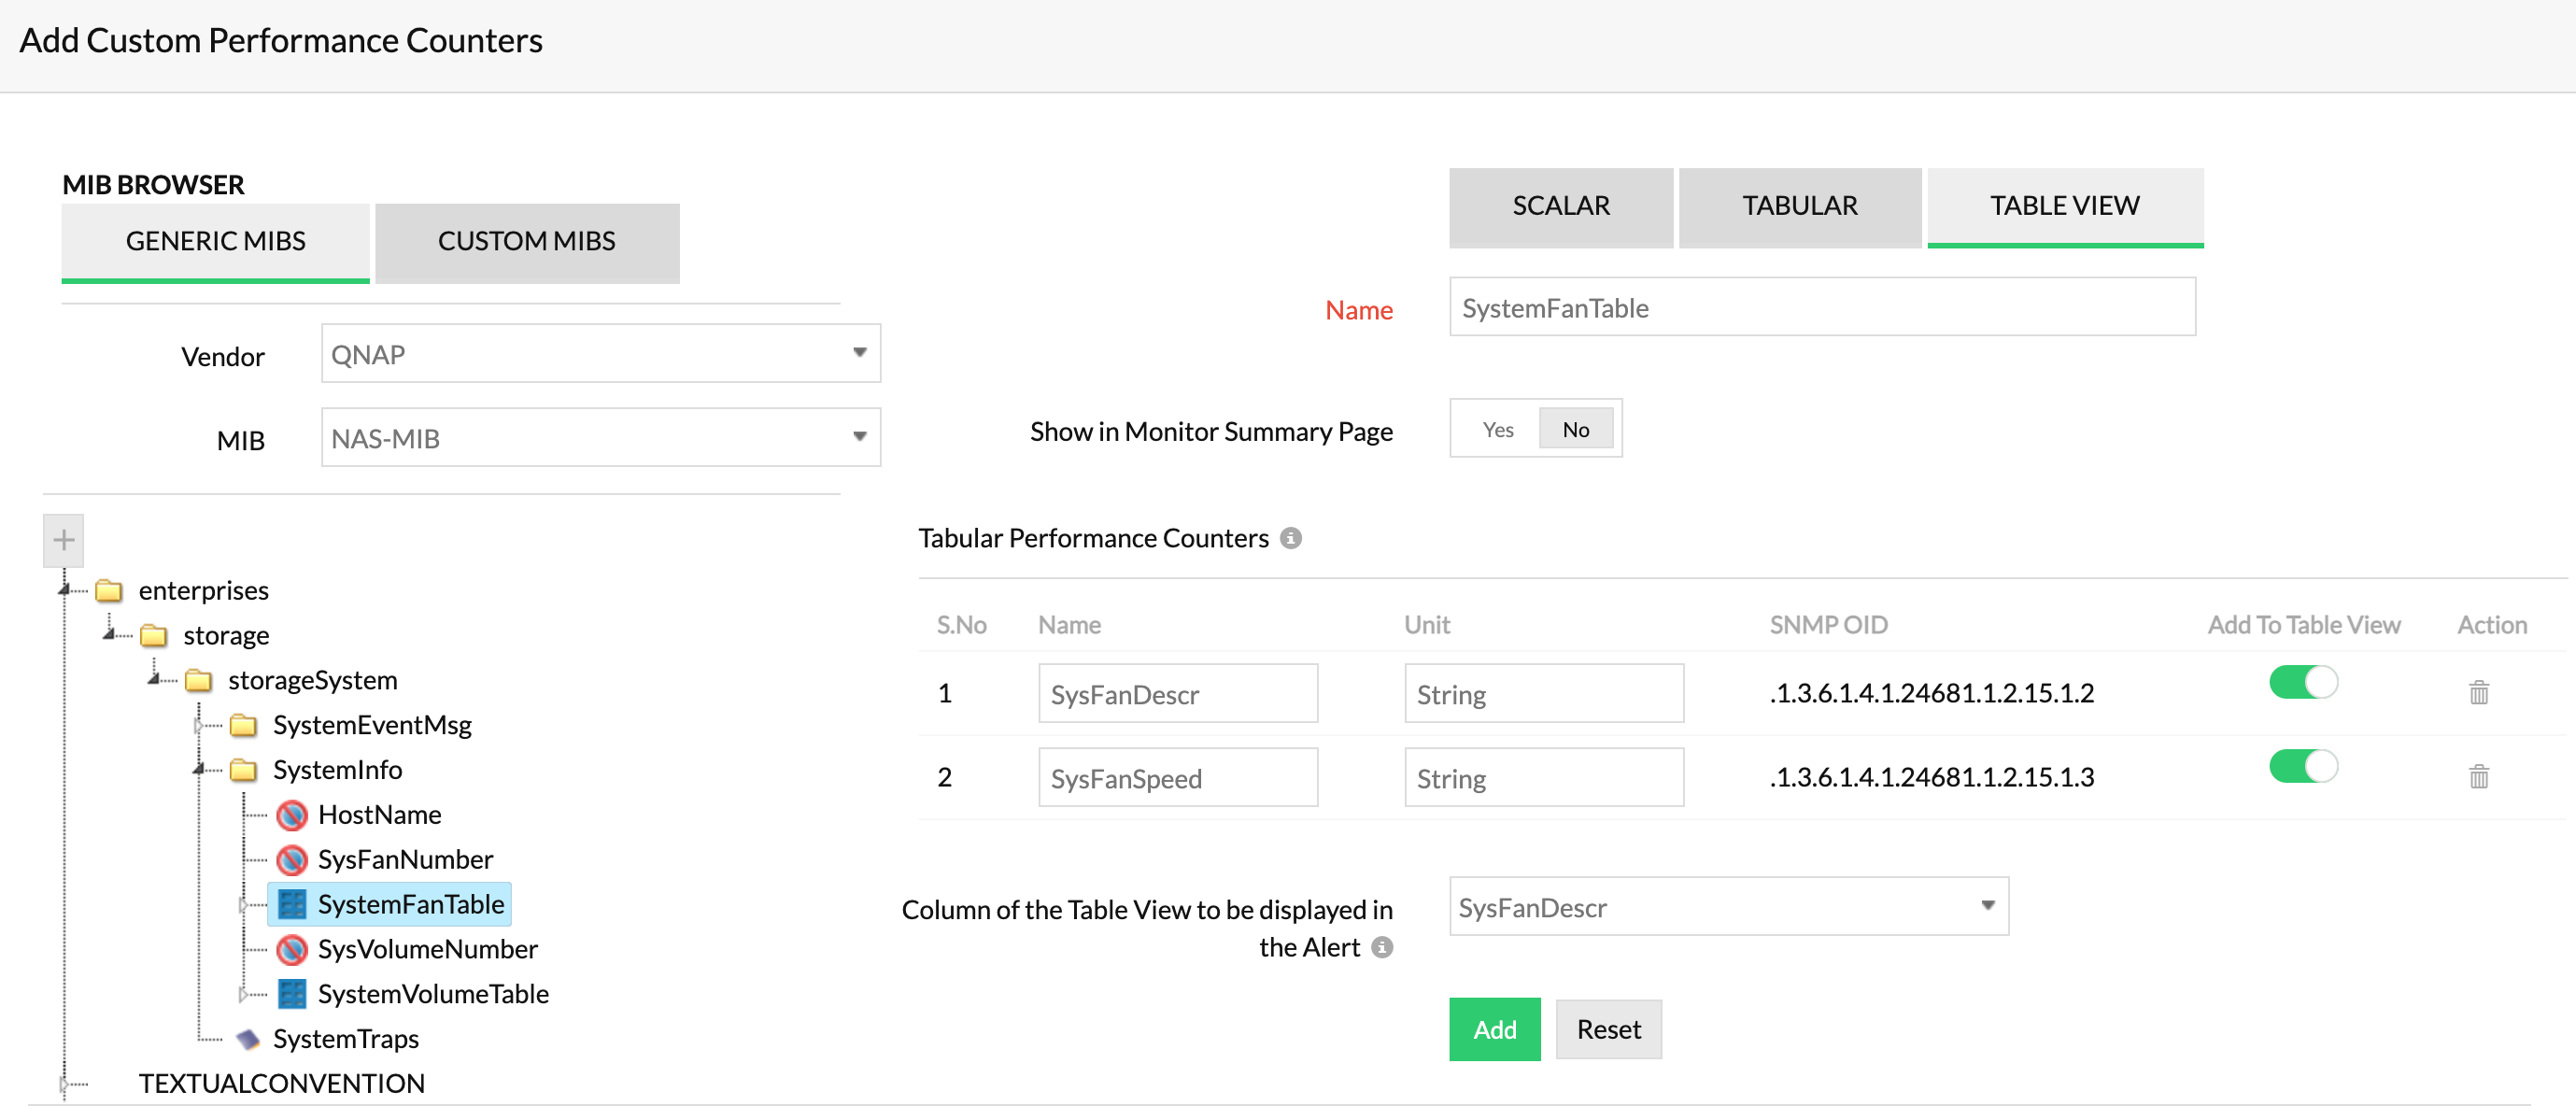
- Table View: View a consolidated table of tabular performance counters that you added to the table (while adding custom performance counters). You can create an all new Table View from here, if you haven't created one yet.
- Show in Monitor Summary Page: Double check your entries from the Add Performance Counters tab. You can also add more to your desired performance counters and tables, and view them on the monitor summary page.
- Click Save to save the custom template. Click Save and Associate to associate the template to a set of network devices.
To add tabular performance counters while editing device templates:
- Click Network > Device Templates.
- In the Device Templates page, click the
 (Edit icon) under Action against the template that needs to be edited.
 - Once the Edit Device Template window pops-up, modify the existing parameters.
- Follow steps 3-7, as above to edit any of these fields.
- Select the required devices under Apply to Associated Devices, in order to apply the changes to the existing devices.
- Click Save to save the custom template. Click Save and Associate to associate the template to a set of network devices.
To add tabular performance counters from the Performance Counters tab:
- Go to Network tab and click on the name of the device you'd like to add performance counters for.
- In the device dashboard that opens, click on the Performance Counters tab.
- Click on the Add Performance Counters button.
- Check the performance counters you'd like to add and click Save.
To add tabular performance counters from the Tabular Performance Counters tab:
- Go to Network tab and click on the name of the device you'd like to add performance counters for.
- In the device dashboard that opens, click on the Tabular Performance Counters tab.
- Click on the Add Performance Counters button.
- Check the performance counters you'd like to add and click Save.
Site24x7 allows only 200 rows per tabular performance counter.
What thresholds of tabular performance counters can I edit?
You can edit thresholds for:
- Individual tabular performance counters
- Individual performance counters in a table
- All tabular performance counters in bulk
To edit thresholds:
- Go to Network > Network Devices.
- Click on the device for which tabular performance counters need to be edited.
- From the device dashboard that opens, go to the Tabular Performance Counters tab.
To edit thresholds for individual tabular performance counters:
- Click on the
 icon next to the tabular performance counter that needs to be edited.
 - In the pop-up, toggle the button if you wish to ignore the alert.
- Enter the monitor value and the unit.
- Click Save.
- Click on the
To edit thresholds for individual performance counters in the table:
- Click on the
 icon next to the performance counter that requires edits to the threshold configuration.
 - In the pop-up, toggle the button if you wish to ignore the alert.
- Enter the monitor value and the unit.
- Click Save.
- Click on the
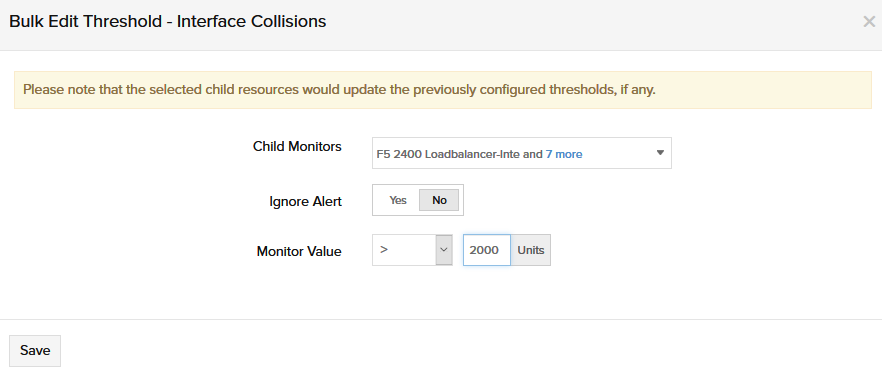
To edit thresholds for individual tabular performance counters in bulk:
- Click on the Threshold Configuration button near the Add Performance Counters button.
- In the pop-up, select the child monitors to edit the threshold configuration in bulk.
- Use the toggle button if you wish to ignore the alert.
- Enter the monitor value and the unit.
- Click Save.
How do I test tabular performance counters?
In the Tabular Performance Counters tab, click on the ![]() icon corresponding to the performance counter for which the threshold needs to be edited.
icon corresponding to the performance counter for which the threshold needs to be edited.
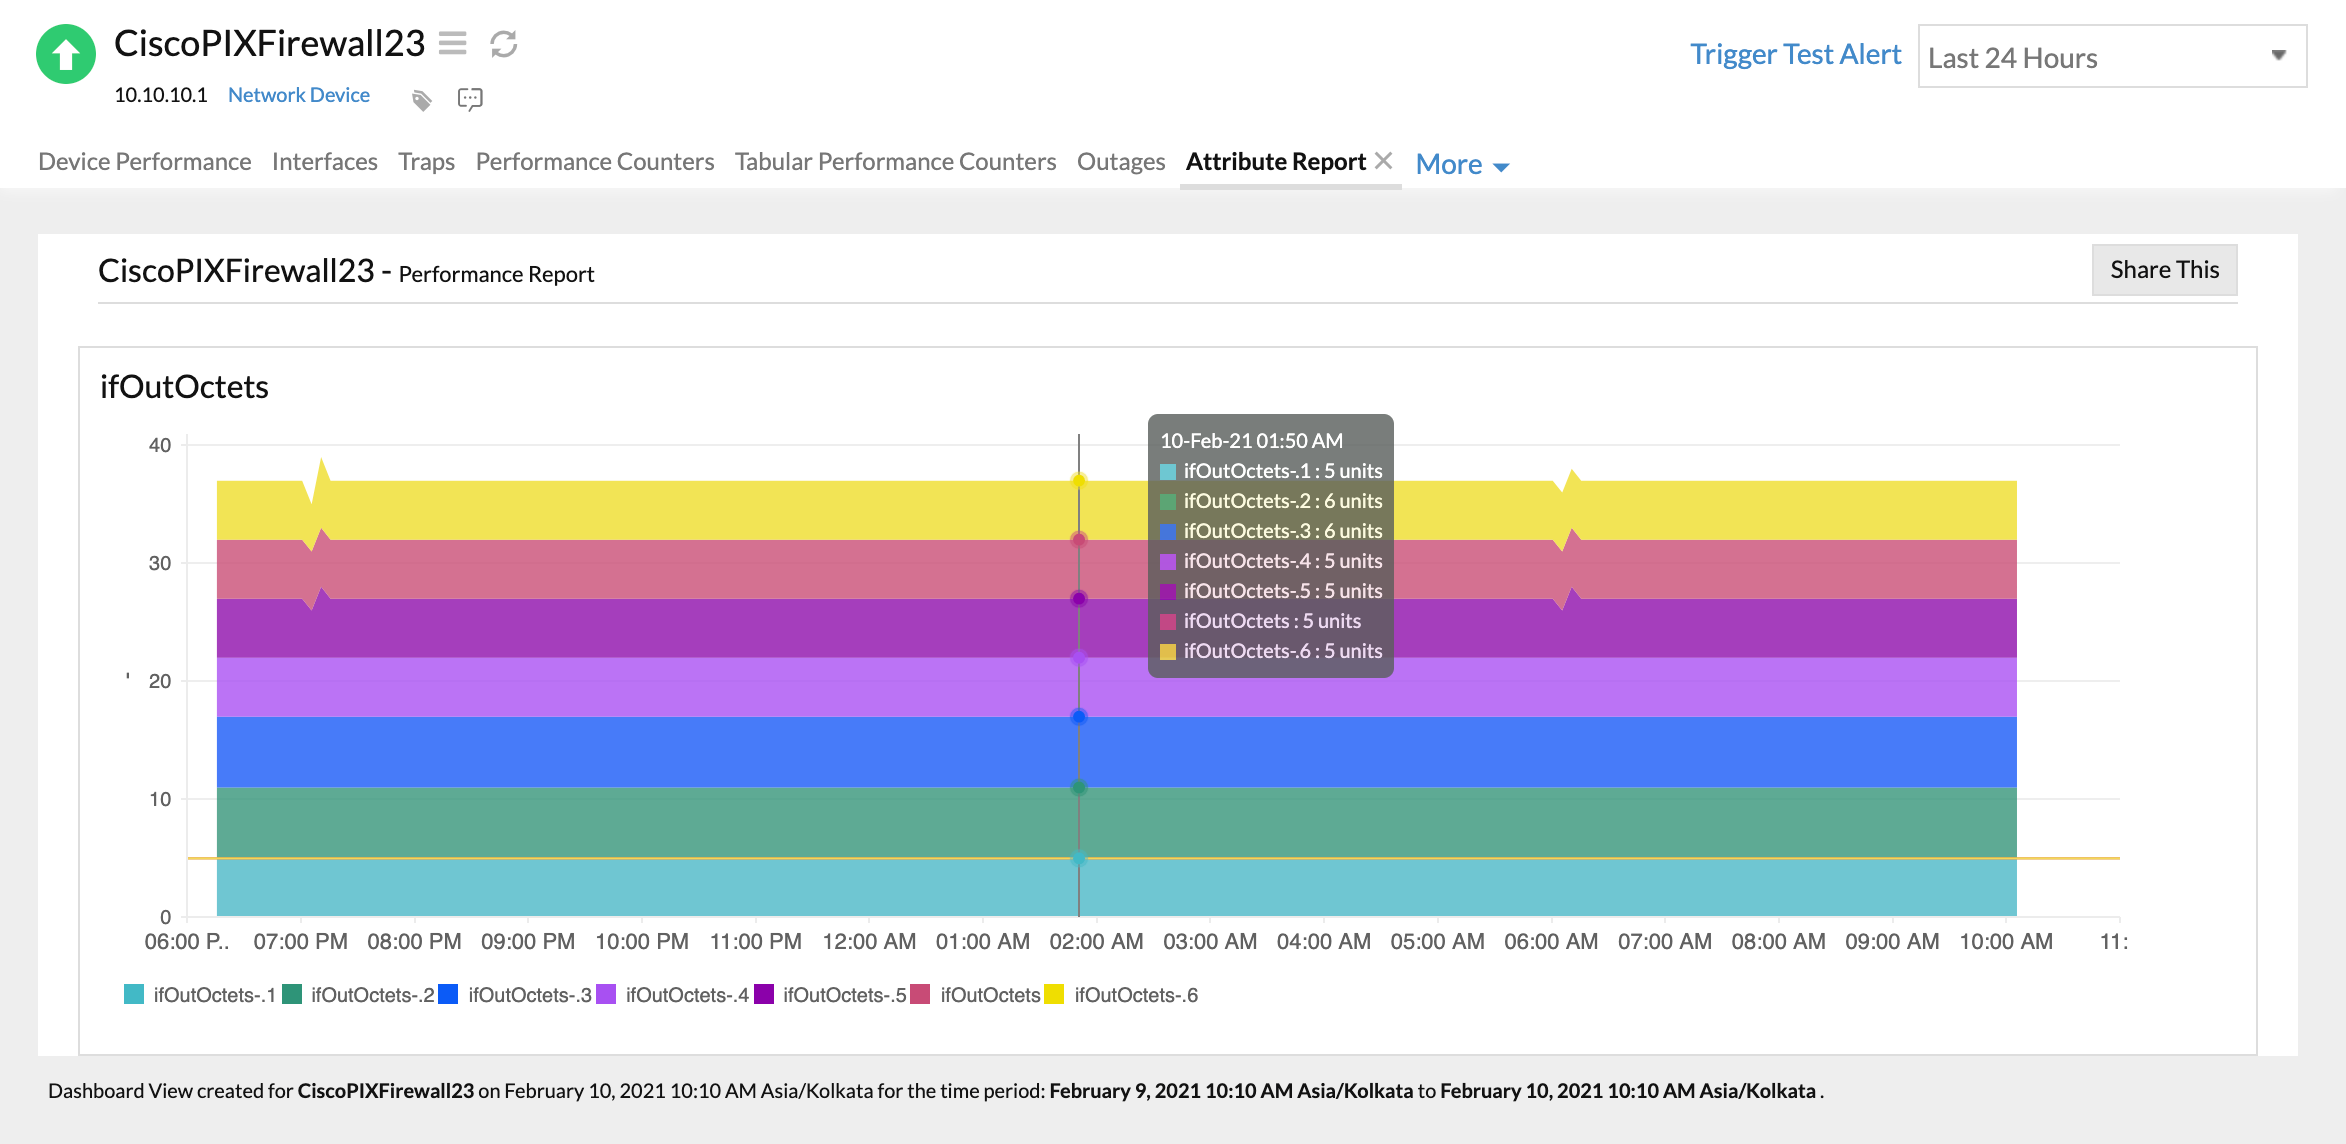
Viewing performance reports
In the Tabular Performance Counters tab, click on the ![]() icon next to a tabular performance counter table to view its performance report.
icon next to a tabular performance counter table to view its performance report.
How do I delete tabular performance counters?
In the Tabular Performance Counters tab, click on the ![]() icon corresponding to the tabular performance counter that you'd like to delete.
icon corresponding to the tabular performance counter that you'd like to delete.