Troubleshoot JavaScript Errors
You can debug JavaScript Errors and find the exact line of error using the Stack Trace.
You can filter JavaScript Errors based on:
- Error lists
- Types
- File
- Browser
- URL/Page
- User
- Domain
You can click individual errors to inspect further.
Interpreting JavaScript Errors using Site24x7 Real User Monitoring (RUM):
- Log in to your Site24x7 account > RUM > Your application > JavaScript Errors.
- Choose a specific time period. In this example, JavaScript Errors that have occurred over the past week are displayed for the ZYLKER app.
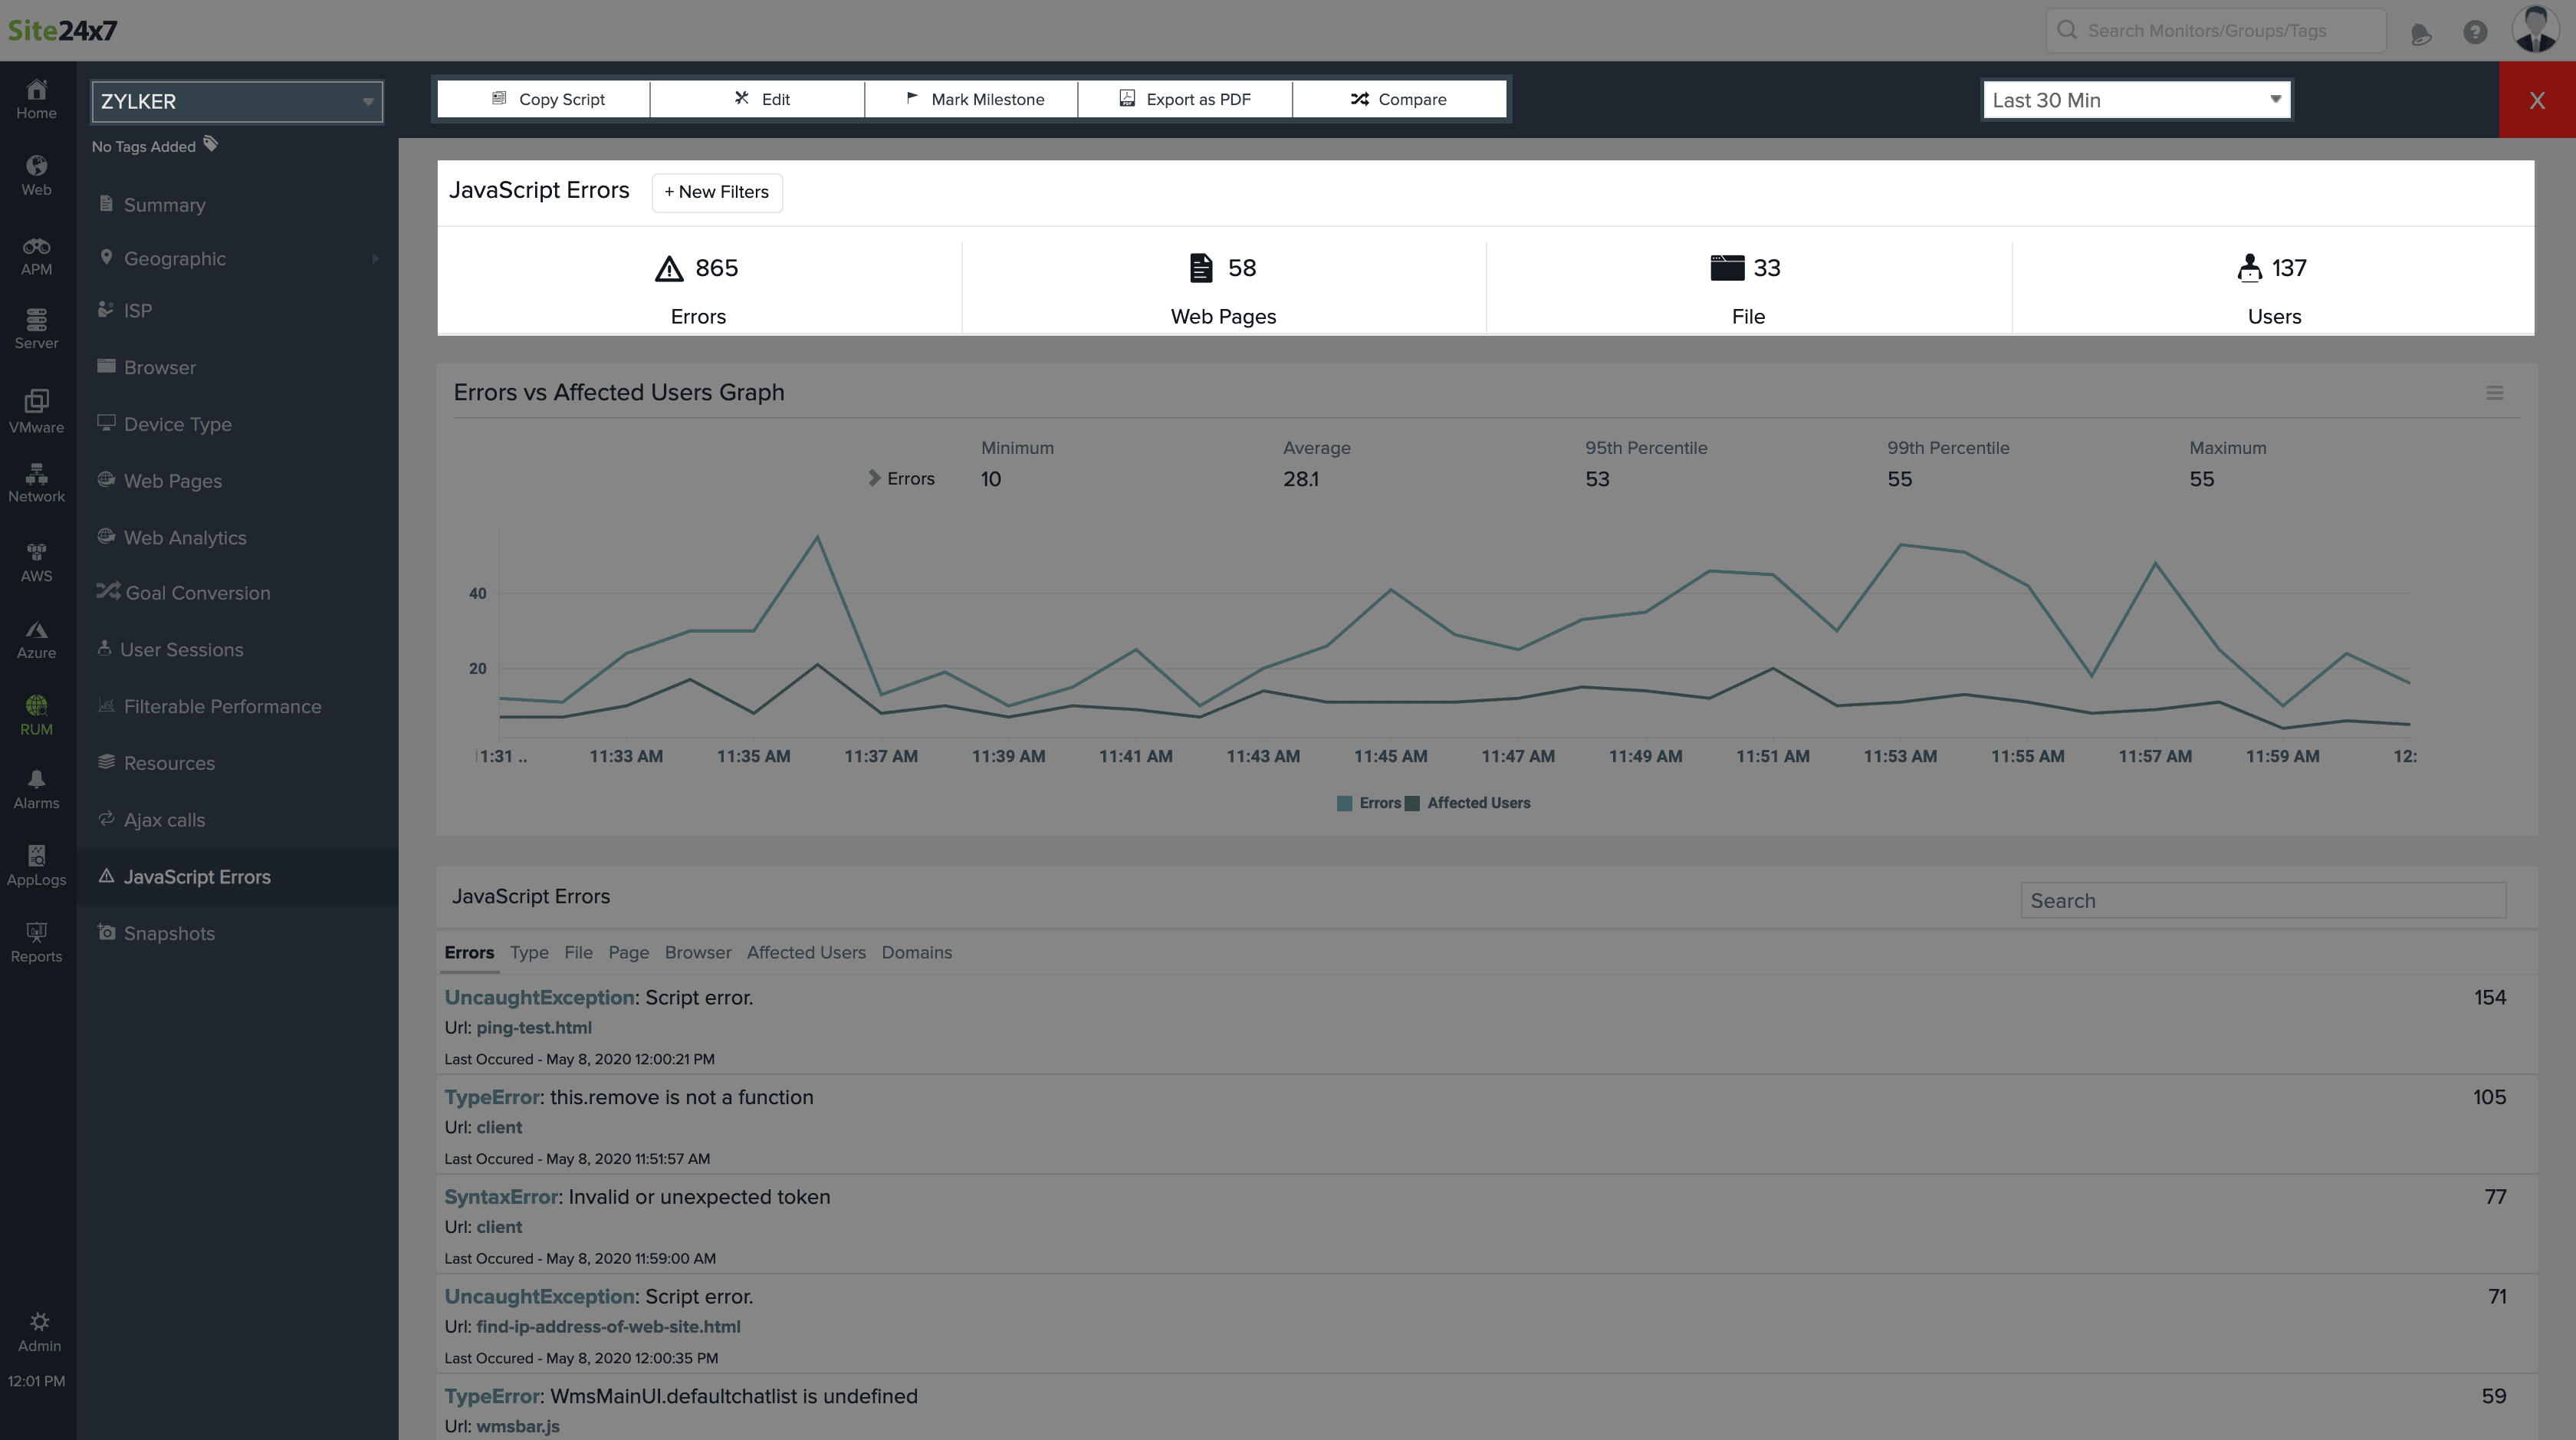
- Here we can see that over 865 JavaScript Errors have occurred over the last week in 33 files and 58 webpages, affecting over 137 users.
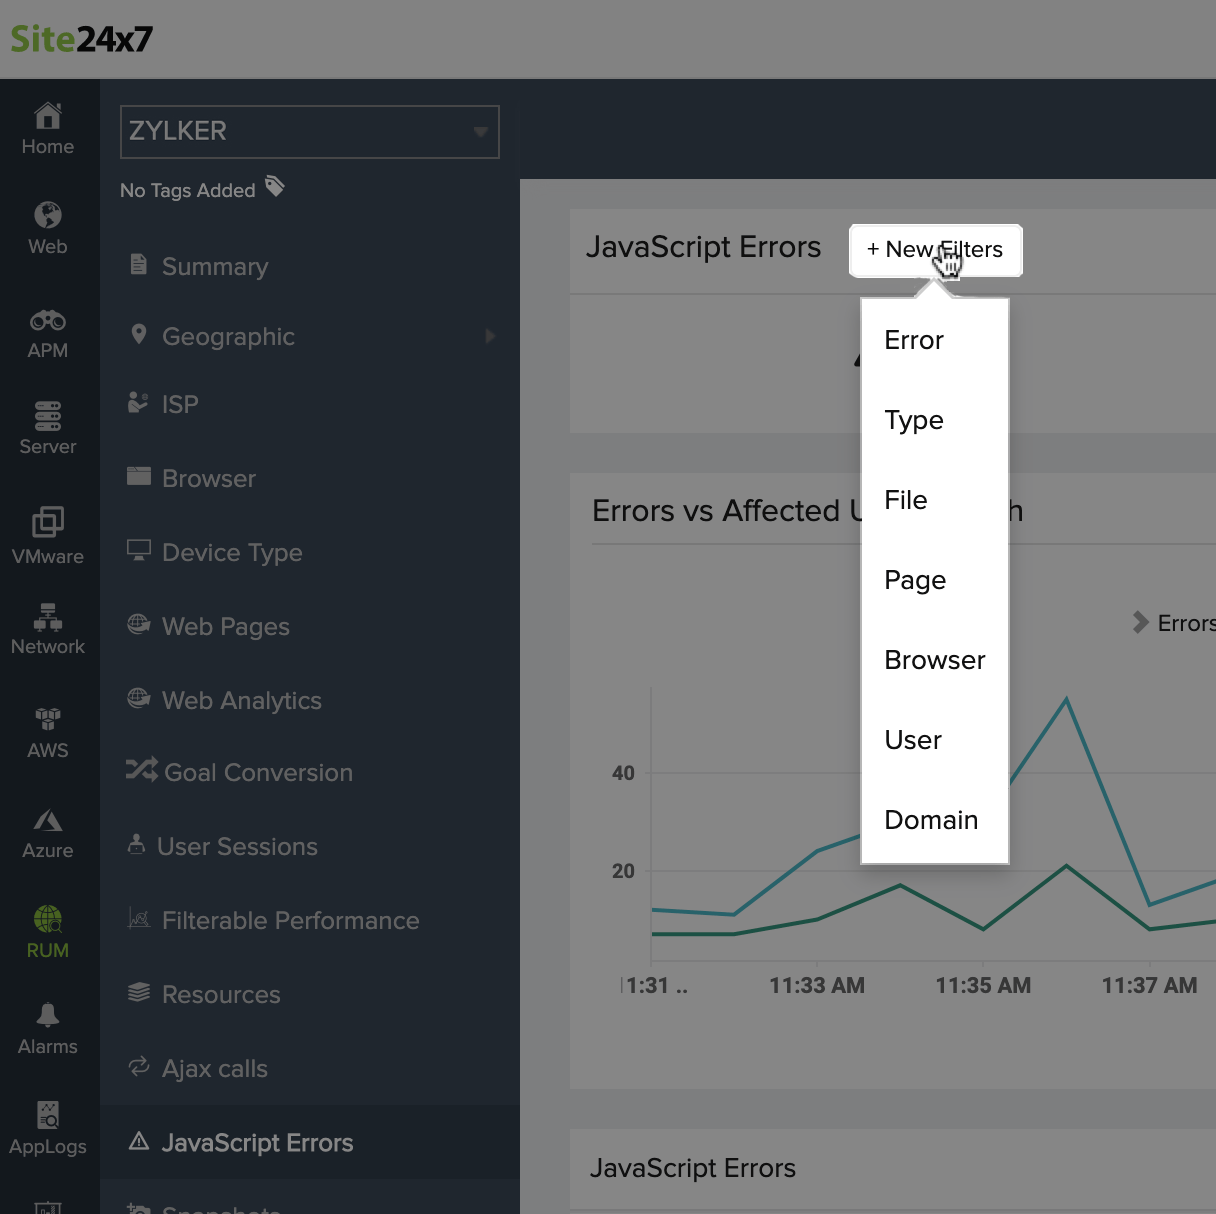
- Click the + New Filter button to narrow down the errors based on Error list, Type, Browser, User, URL/Page, or Domain.
- For our example, the errors are filtered based on Type. Choose Script Error and click Save.
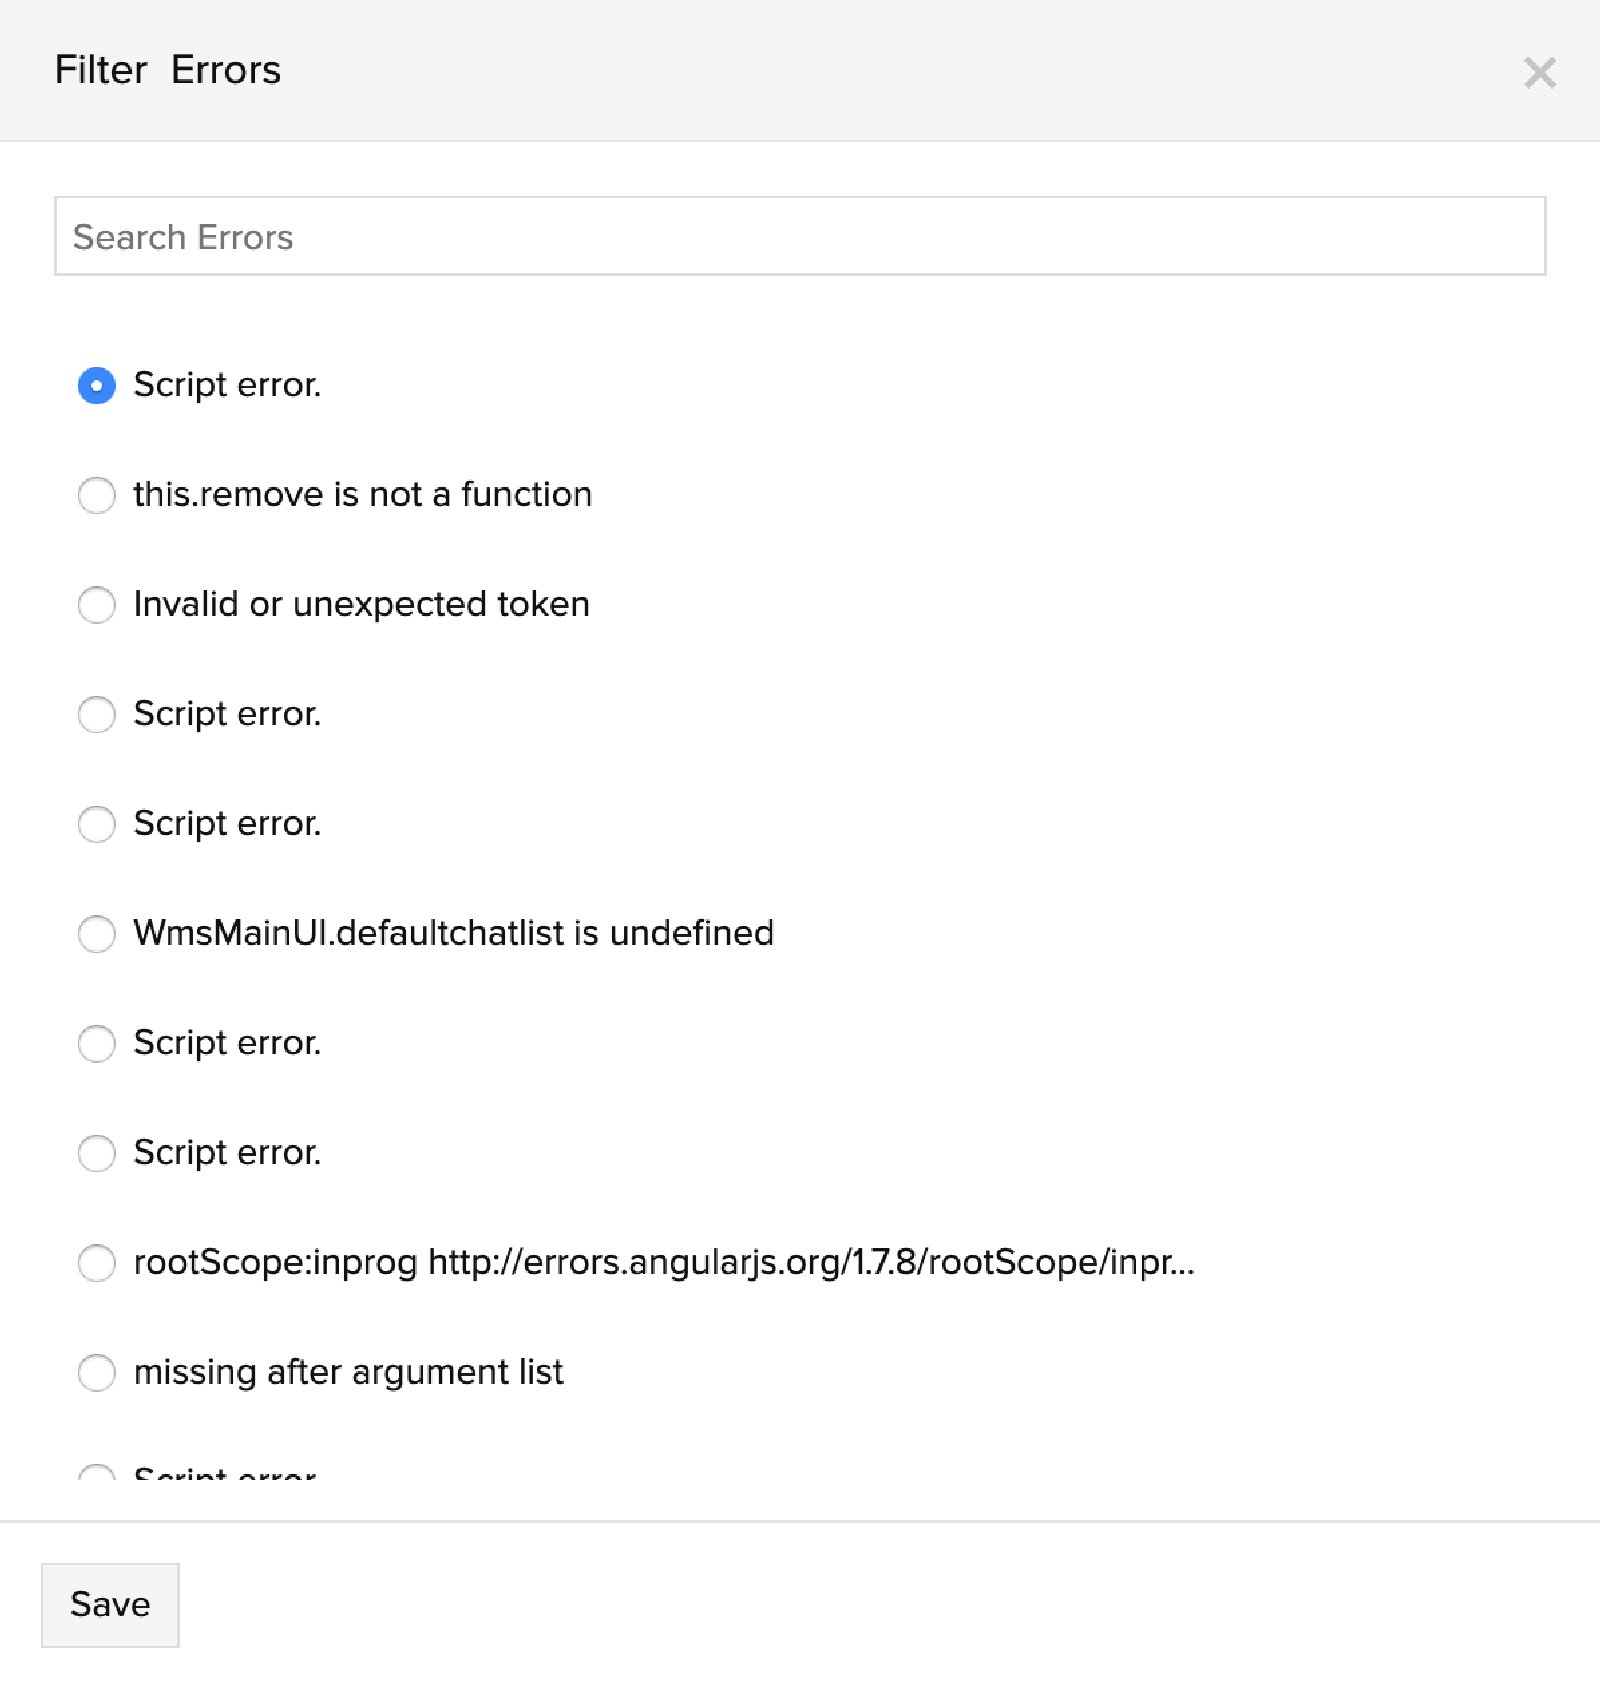
- You can also use multiple filters. For example, you can choose to see the number of syntax errors that have happened on a Chrome browser.
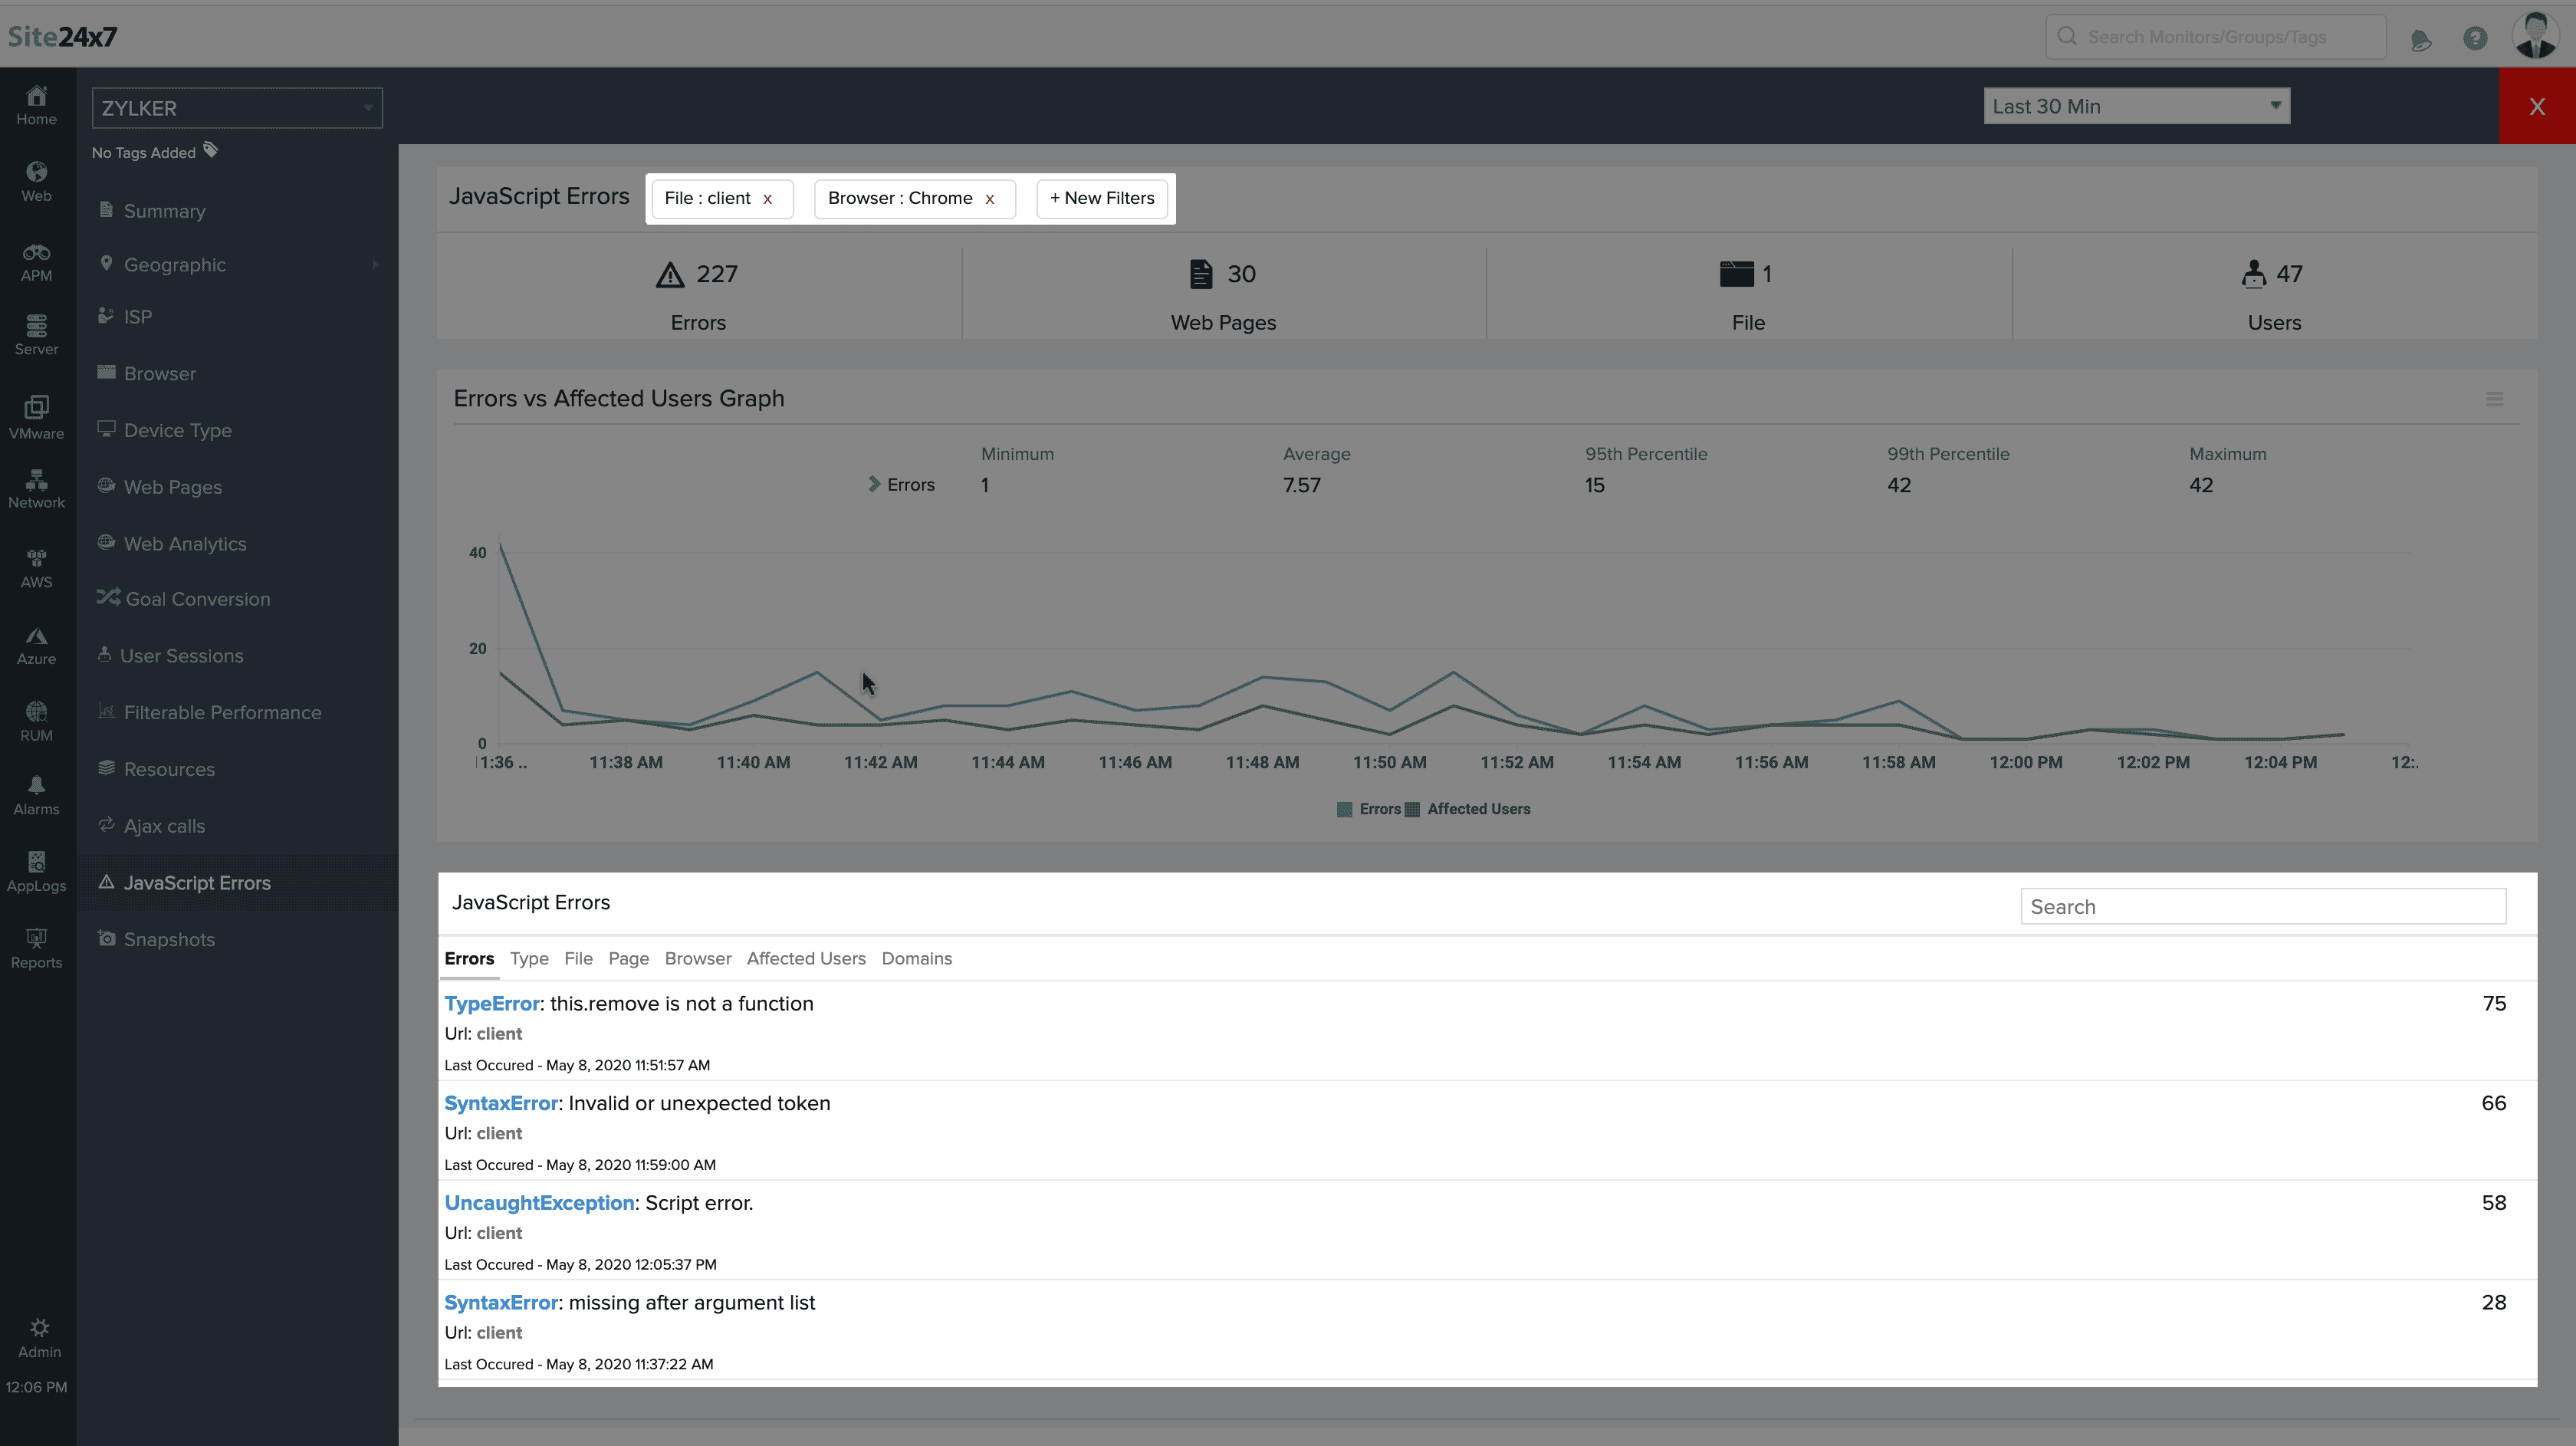
- Applying the above filters shows us three JavaScript Errors. Click any of the errors to inspect further.
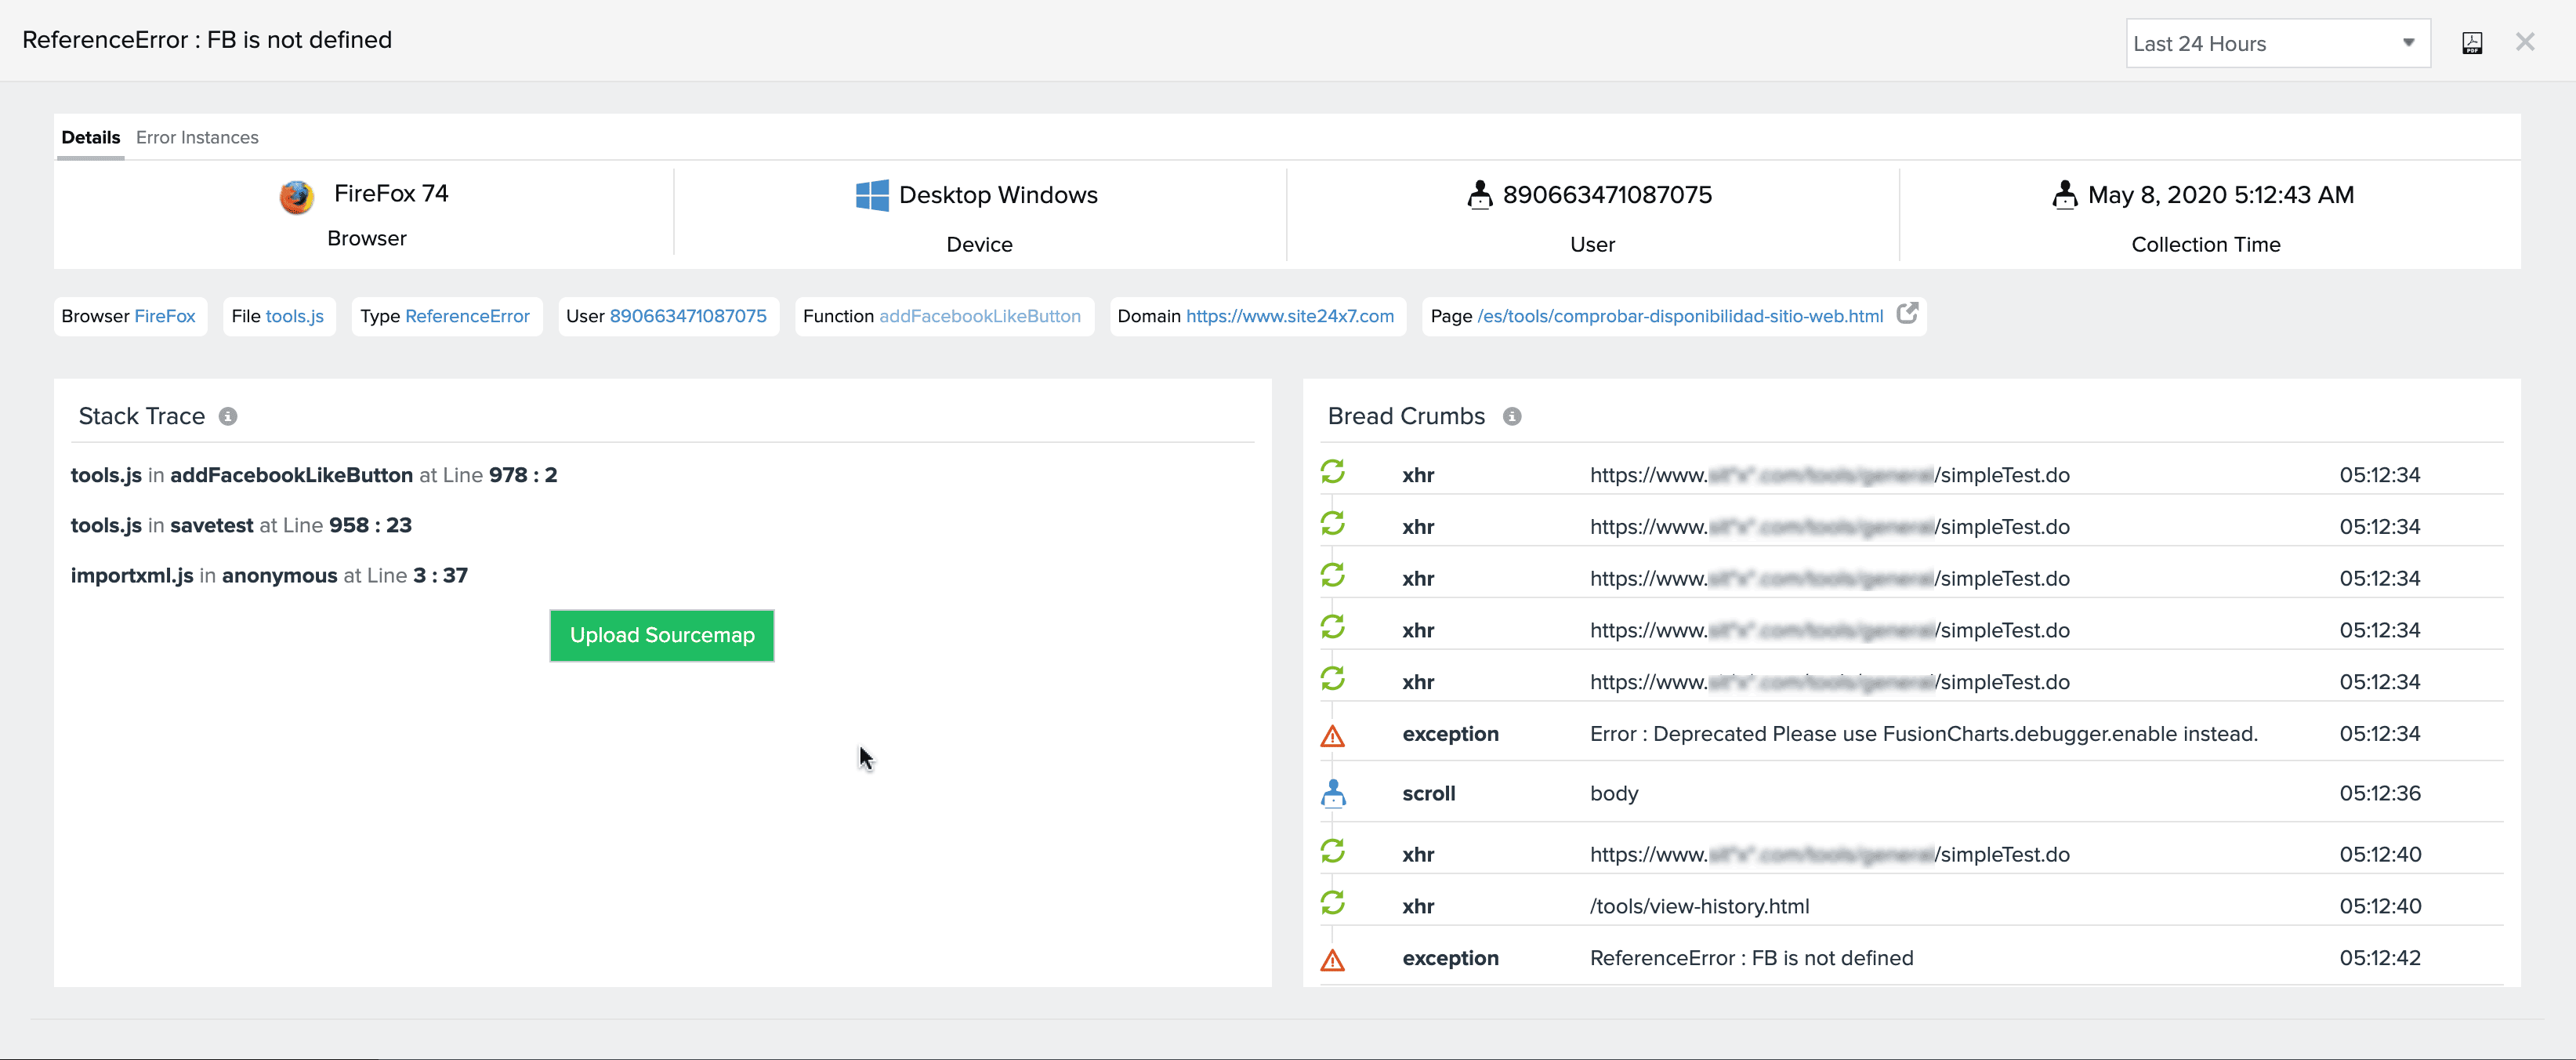
- From the above image, you can clearly drill down to the exact instance of this particular error occurring.You can also find the line of code in the error using the Stack Trace. If your JavaScript file is minified, you can upload your sourcemaps to debug further.
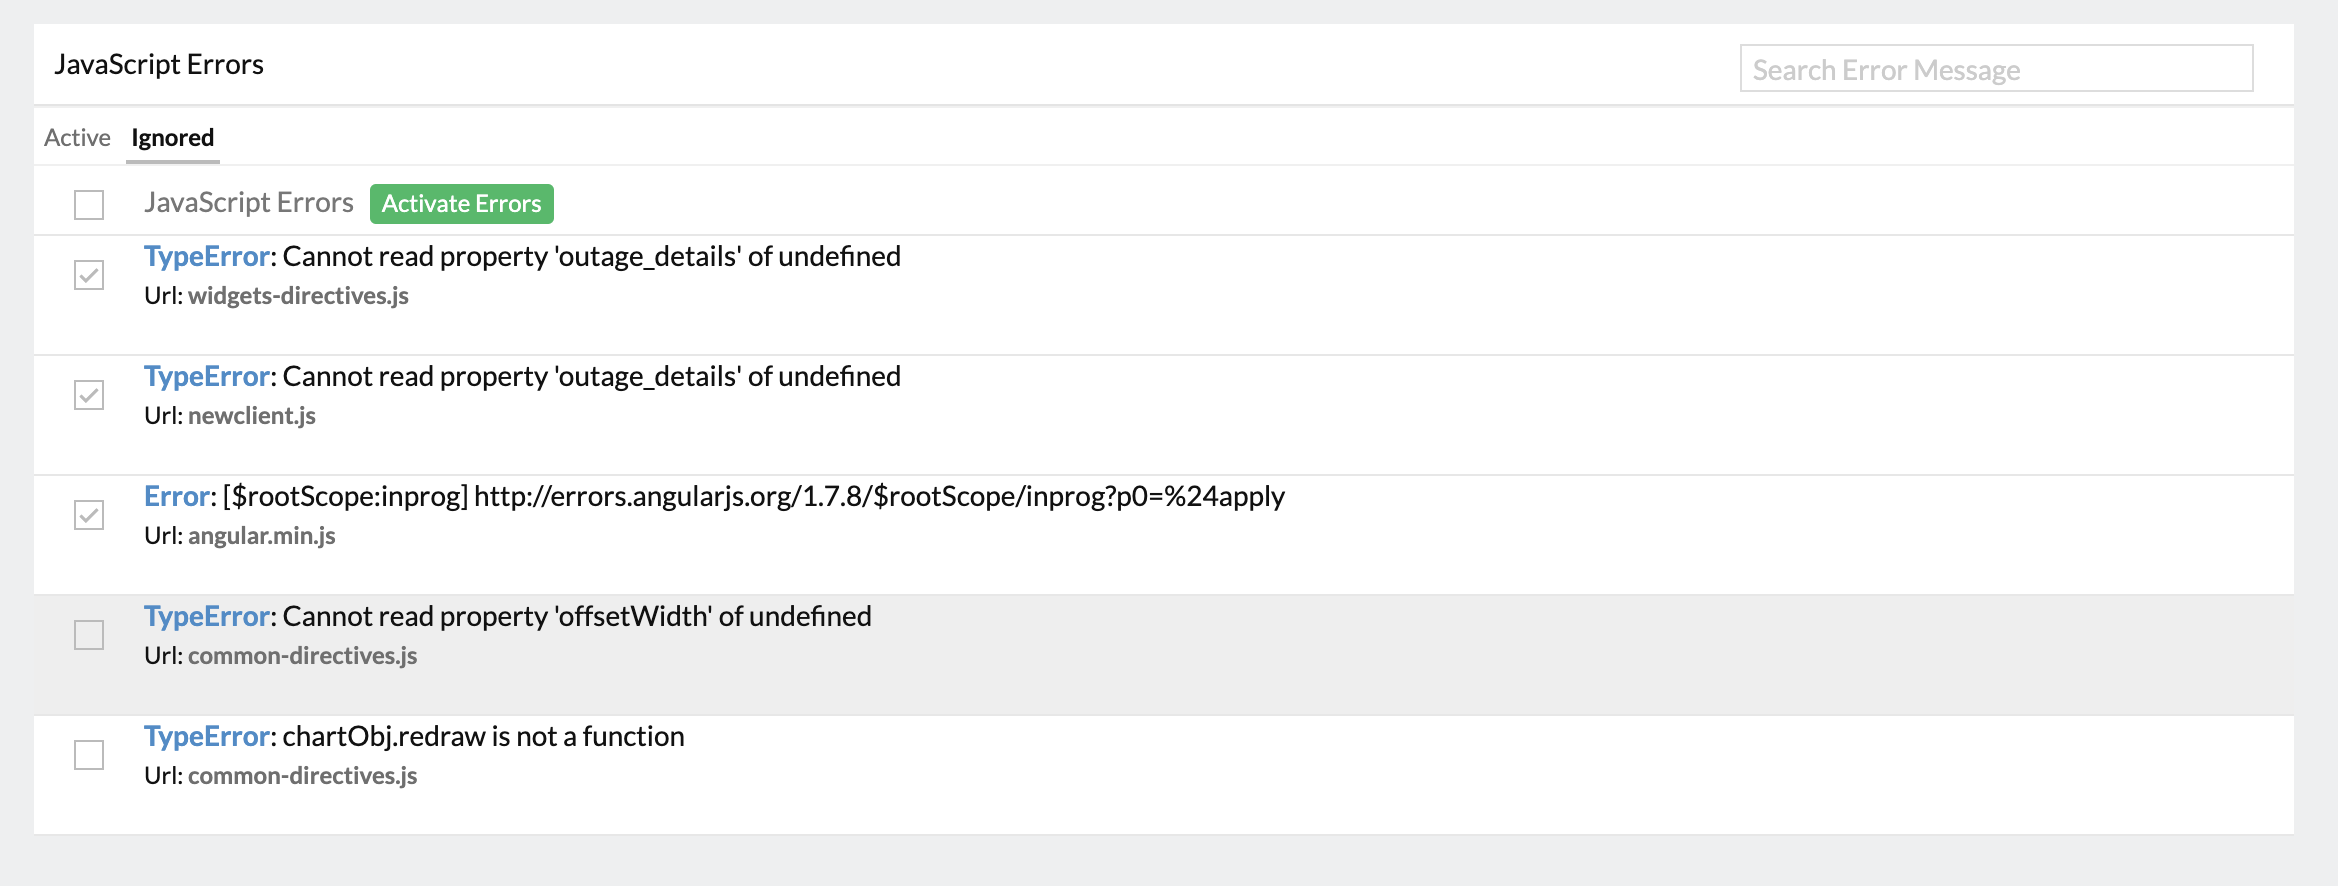
- You can also ignore certain JS errors if you don't want to track. Simply click on 'Ignore' and the selected JS errors will not be captured further.

- You can also click on 'Activate' to captured the previously ignored JavaScript errors.
- Click Error Instances to find all the occurrences of this particular error.
- You can export this information as a PDF file.
Note: You can upload the source map of a JS file to identify the exact line of error in a stack trace.
- Please follow the below given steps:
- Log in to your Site24x7 account > go to RUM > click on your application.
- Navigate to JavaScript errors > Click on an error.
- Upload the corresponding JS source map by clicking on Upload Source Map.
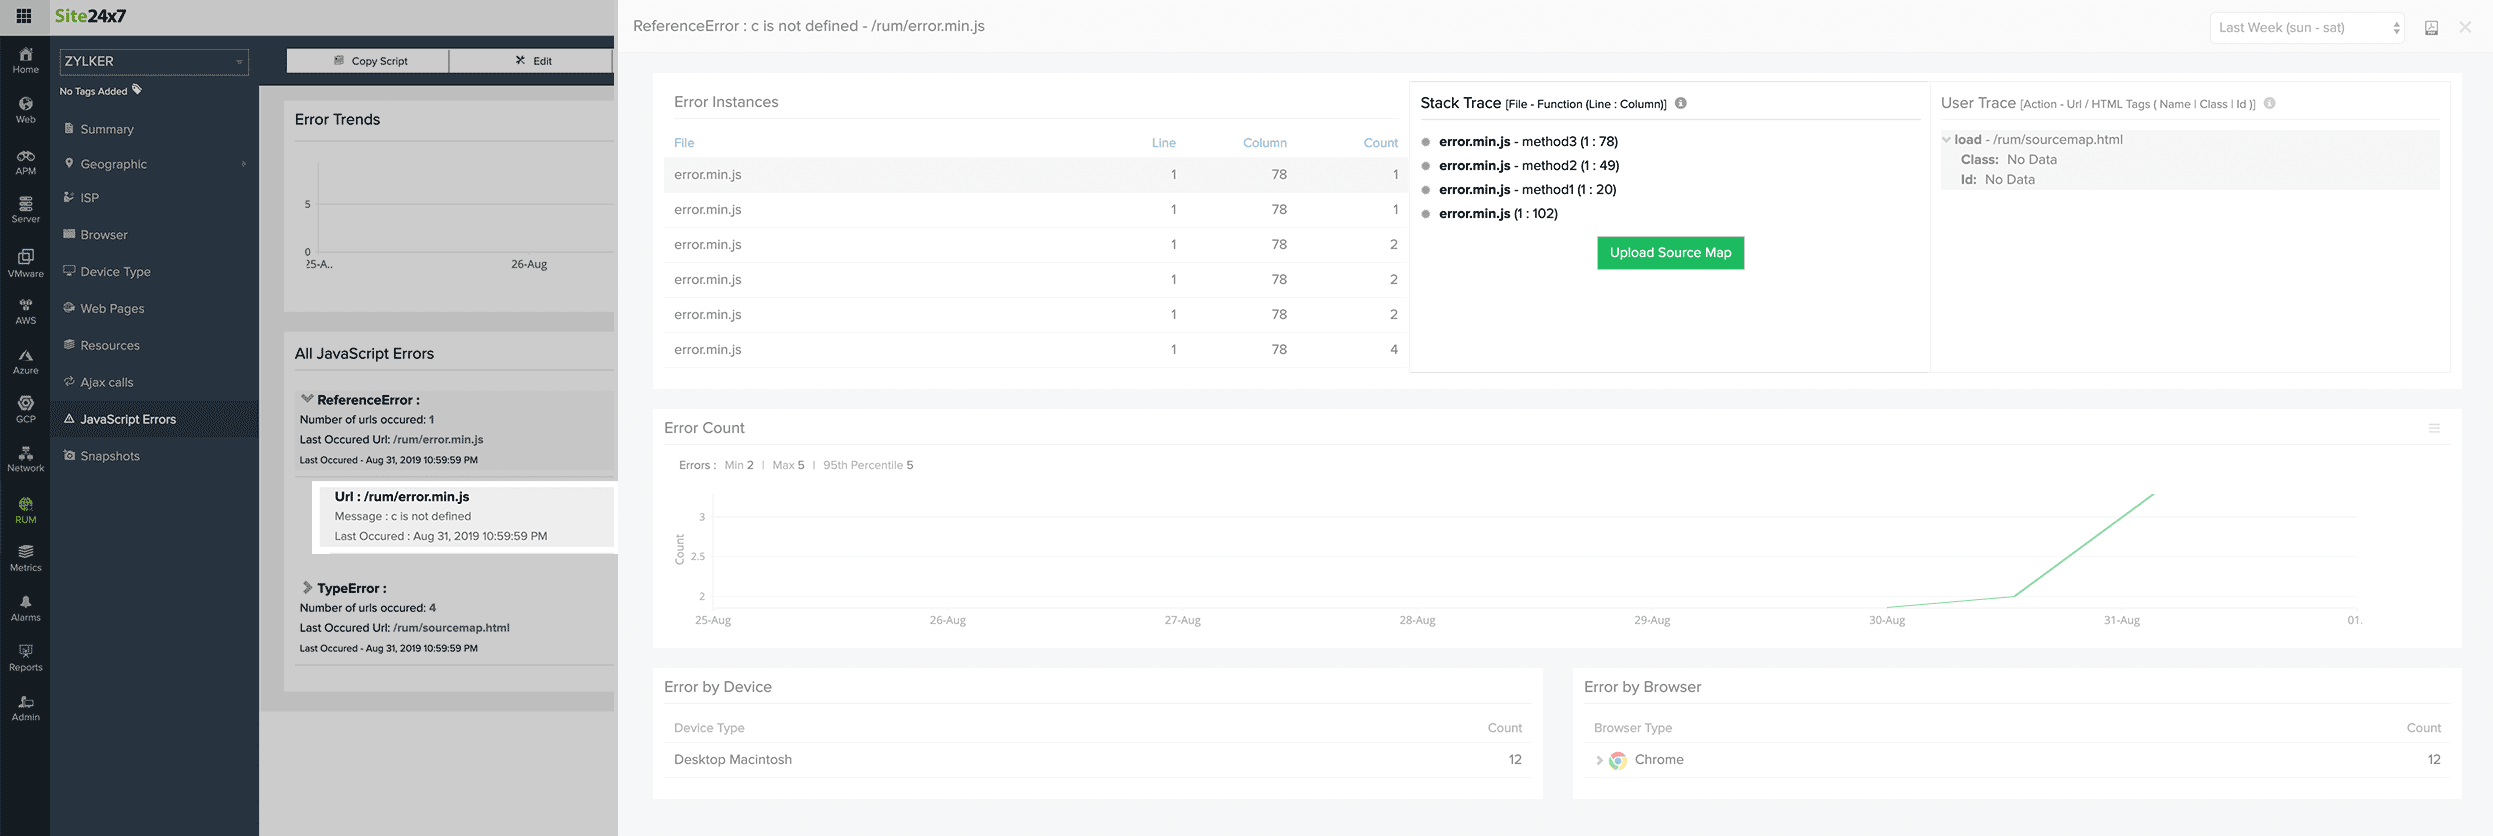
- You can now view the exact line of error in the stack trace. Click on Export CSV to download your stack trace as a CSV file.
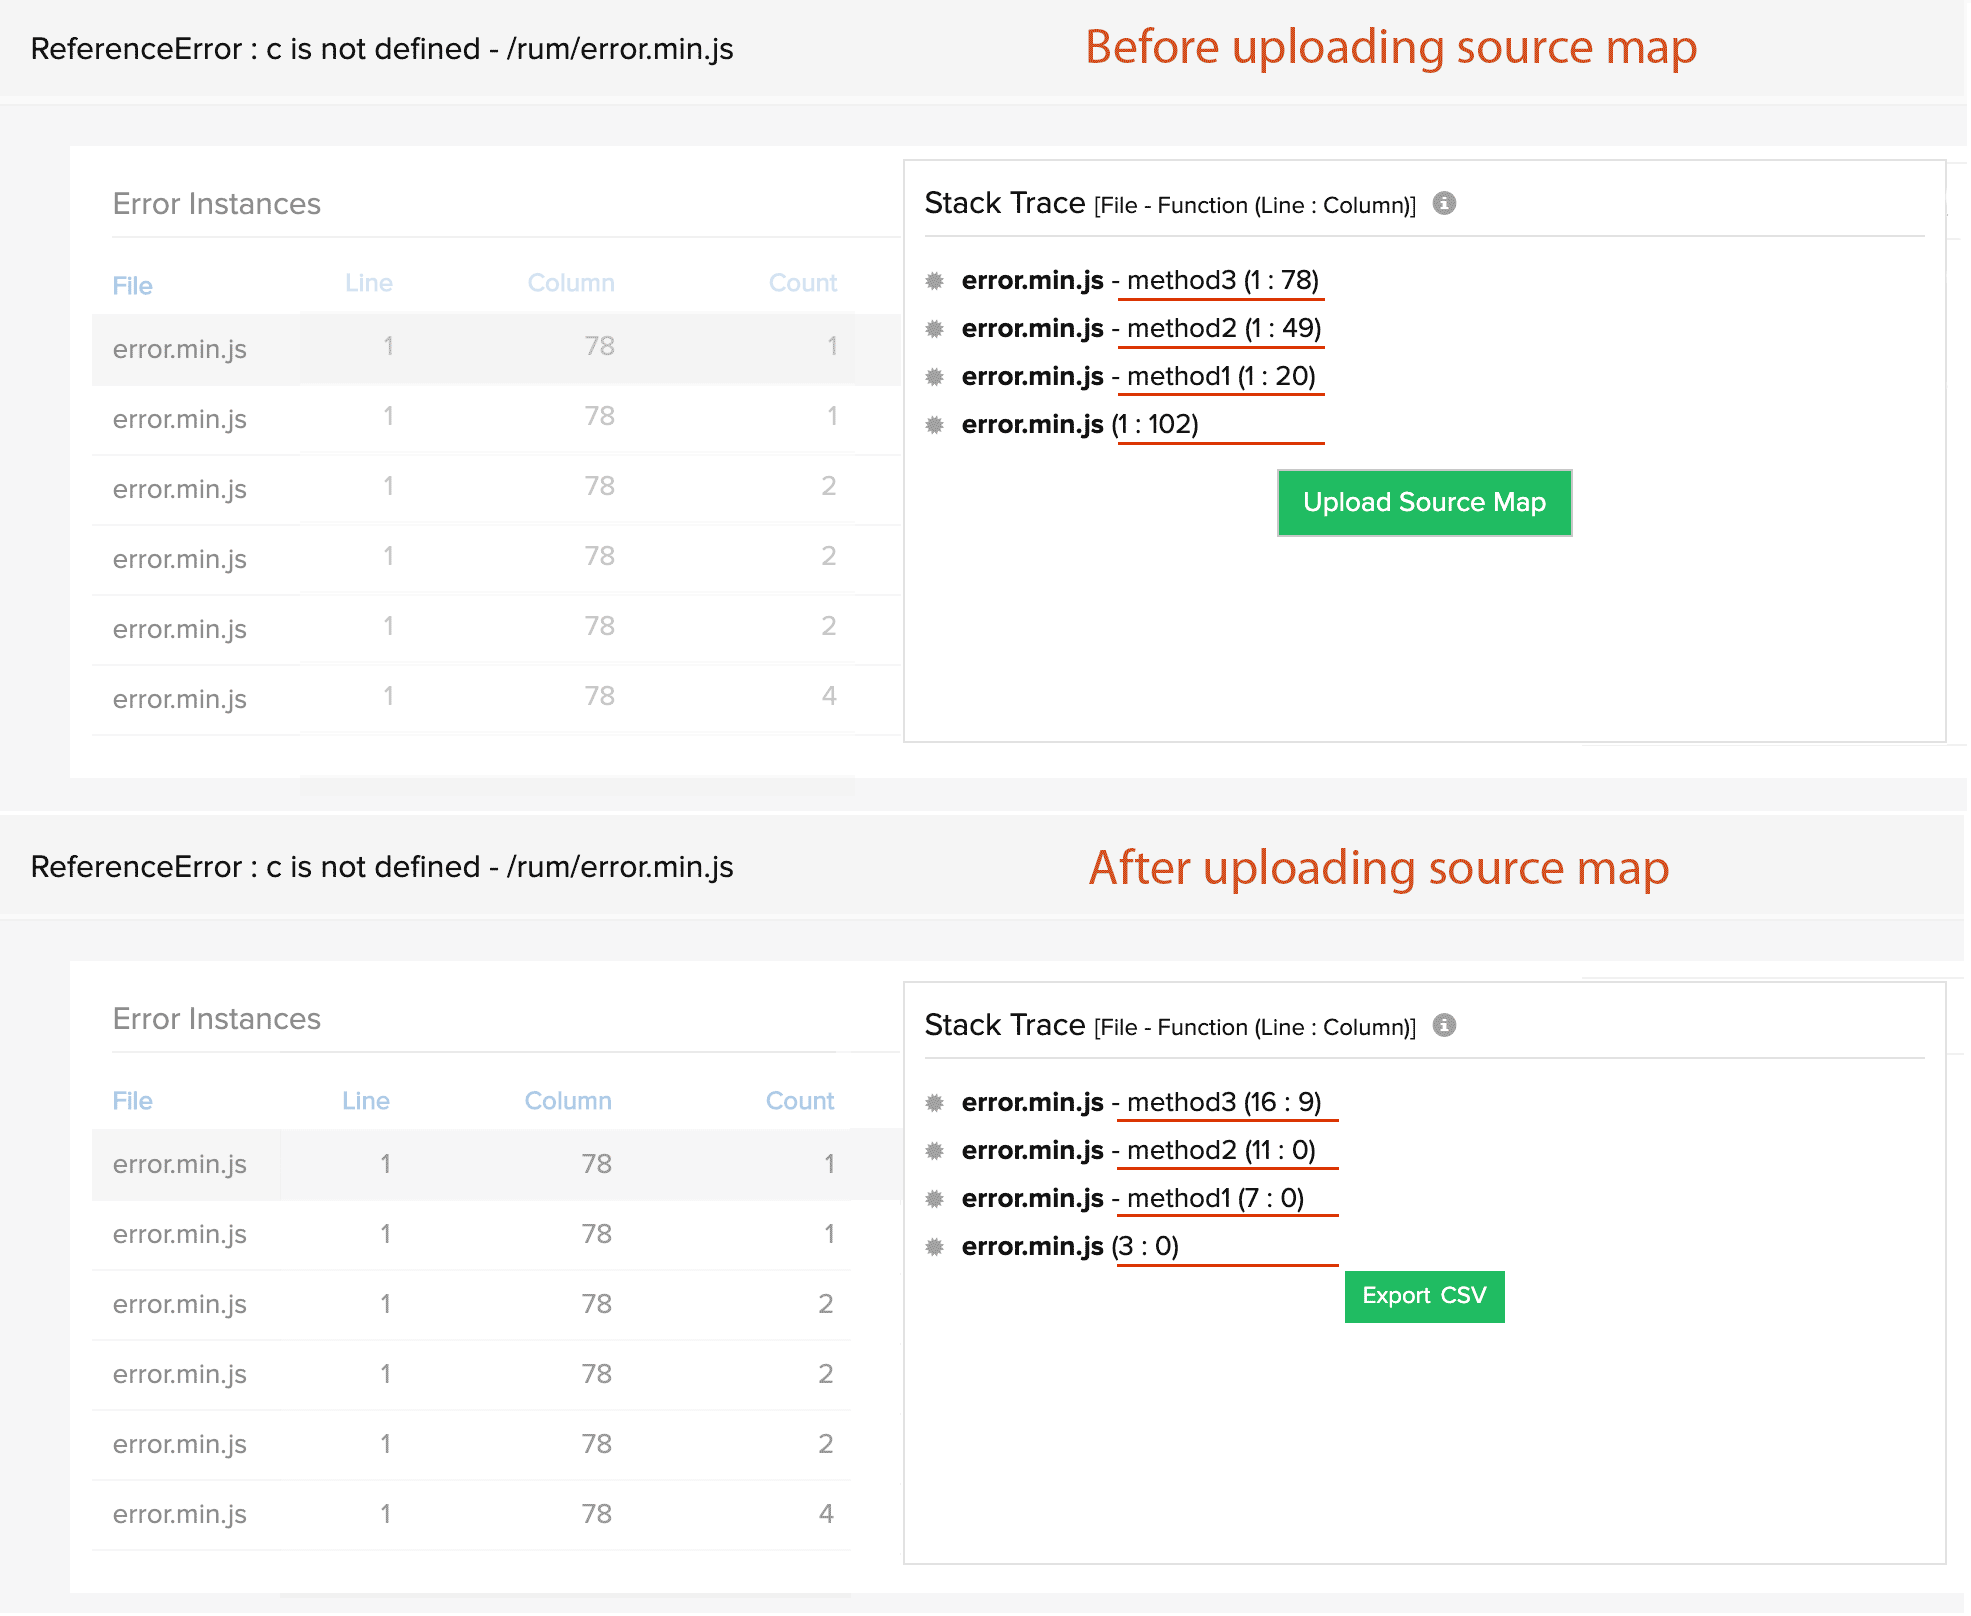
Learn more about source maps and how to generate them.