Web Vitals
Web Vitals are modern user-centric metrics developed by Google that measure a user's experience loading a webpage. These measurements assess how quickly a web page's content loads, how quickly a browser responds to a user's input, and how stable the content loads in the browser. These factors will be taken into account when Google ranks your web pages for mobile devices.
Currently, Site24x7 RUM measures four web vitals.
- Cumulative Layout Shift- This score is used to determine the "visual stability" of a page. The lower the CLS score, the better the visual stability.
- First Input Delay- This score is used to measure the time between when a user interacts with your site for the first time (i.e. when they click a link, tap a button, or press a key) and when the browser can reply to that interaction.
- Largest Contentful Paint- It measures the time from when the page starts loading to when the largest text block or image element is rendered on the screen.
- First Contentful Paint- It measures the time from when the page starts loading to when any part of the page's content is rendered on the screen.
The Web Vitals Thresholds to Categorize the Performance
| Good | Needs Improvement | Poor | |
|---|---|---|---|
| Cumulative Layout Shift | Less than 0.1 | 0.1 to 0.25 | More than 0.25 |
| First Input Delay | Less than 100 ms | 100 ms to 300 ms | More than 300 ms |
| Largest Contentful Paint | Less than 2500 ms | 2500 ms to 4000 ms | More than 4000 ms |
| First Contentful Paint | Less than 1800 ms | 1800 ms to 3000 ms | More than 3000 ms |
To View the Web Vitals Metrics
Log in to your Site24x7 account > RUM > Your application > Web Vitals.
Web Vitals Tab
Under Metrics Summary, you'll get a summary of all the four web vitals, such as minimum value, average value, maximum value, 1st percentile, 5th percentile, 50th percentile, and so on.
Under Web Vitals Breakdown, you'll get a graphical representation of the web vital metrics.

Figure 1: Overview of Web Vitals.
Under Web Vitals Report, you'll get the web vitals reports for Web Pages, Devices, Browser, Users, Domains, Connection Types, Top Viewports, and Device Memory.

Figure 2: Web Vitals Report.
Largest Contentful Paint Tab
You can view the split-up of the Good, Needs Improvement, and Poor web pages, as well as the list of affected elements' count and score. Below is the histogram distribution representation marking the 75th percentile, which Google considers to be the standard score. The Web Vitals Report is also available at the bottom of the page.

Figure 3: Overview of Largest Contentful Paint Tab.
To Filter and Analyze the Web Vitals Data
You can analyze your website performance by filtering it based on various parameters, including pages, browsers, devices, connection types, users, domains, metric types, and so on.

Figure 4: Filtering the Web Vitals Data.
To View the Web Vitals Data in the Web Pages
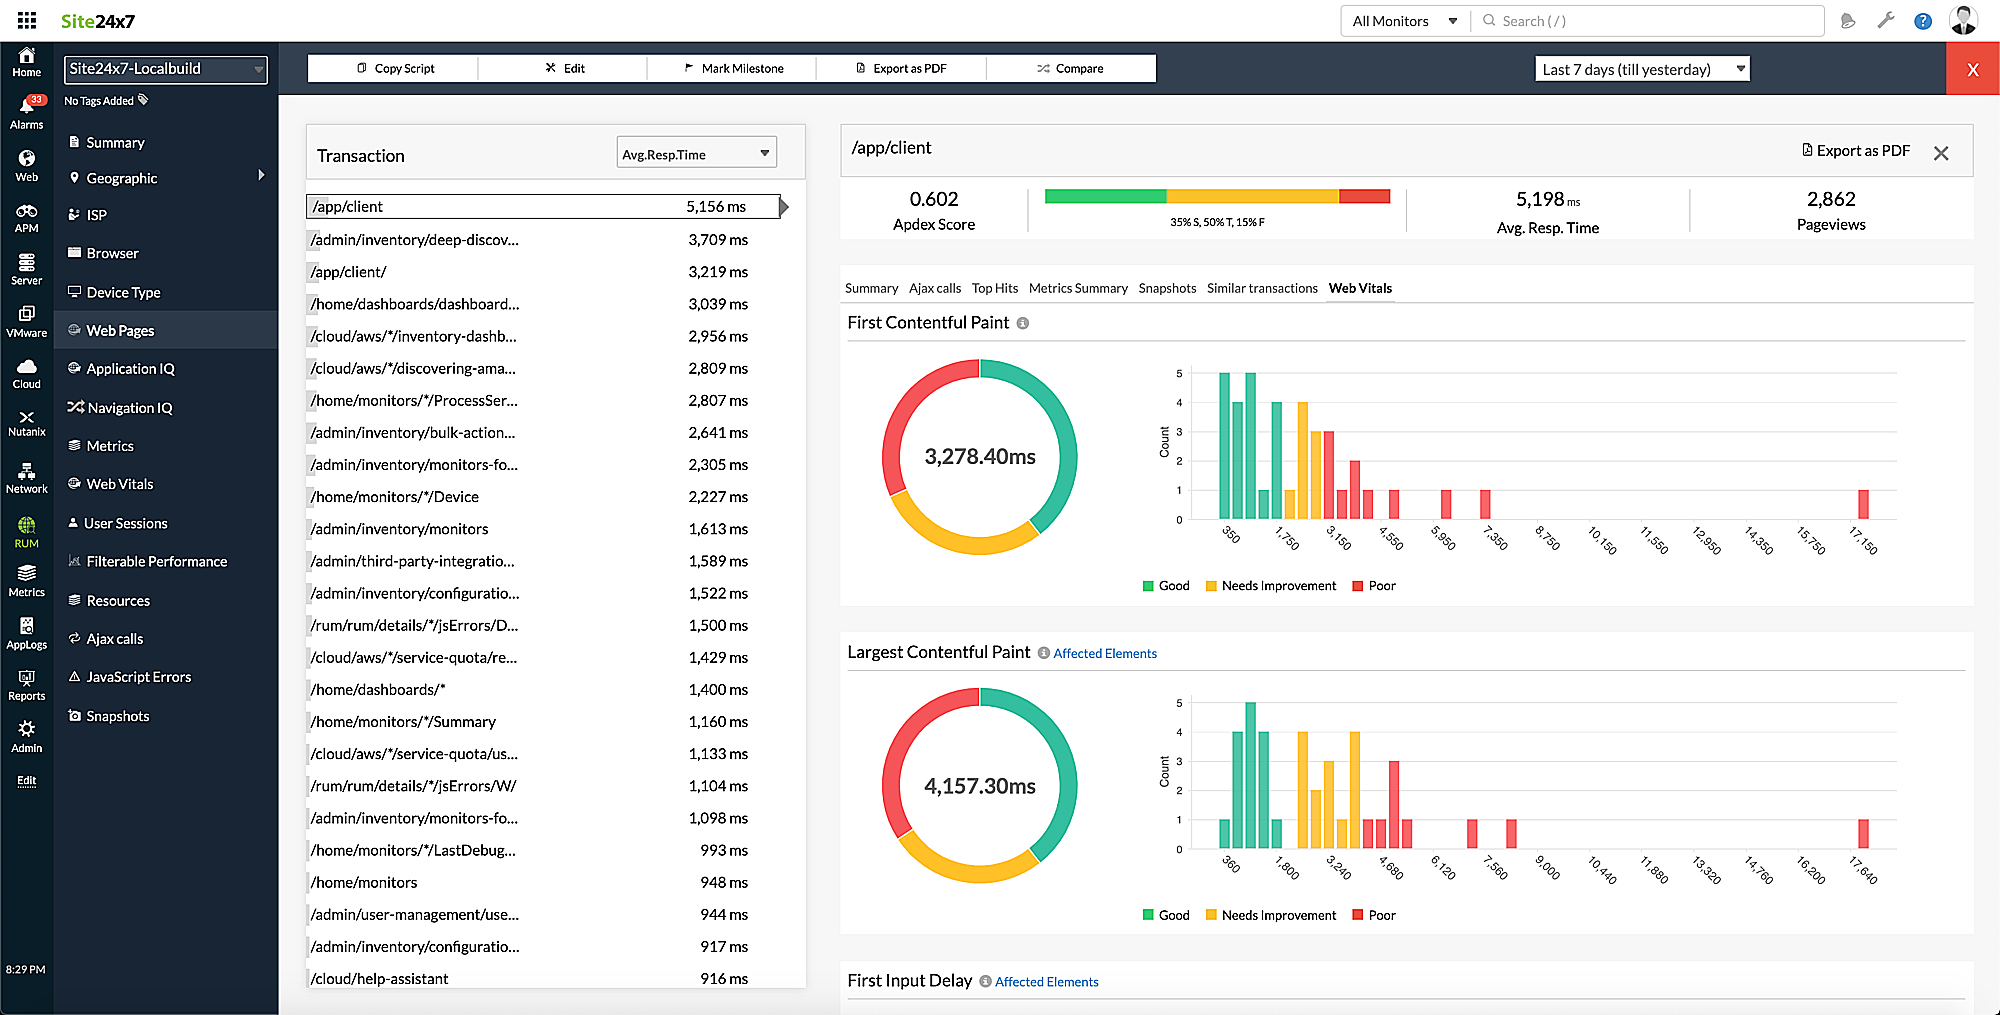
Log in to your Site24x7 account > RUM > Your application > Web Pages. Click the required transaction to get the split-up and histogram distribution of all the web vitals.

Figure 5: Web Vitals Data in the Web Pages.